
|
Ningbo Solartron Technology Co., Ltd. (688299.SS) Évaluation DCF |
Entièrement Modifiable: Adapté À Vos Besoins Dans Excel Ou Sheets
Conception Professionnelle: Modèles Fiables Et Conformes Aux Normes Du Secteur
Pré-Construits Pour Une Utilisation Rapide Et Efficace
Compatible MAC/PC, entièrement débloqué
Aucune Expertise N'Est Requise; Facile À Suivre
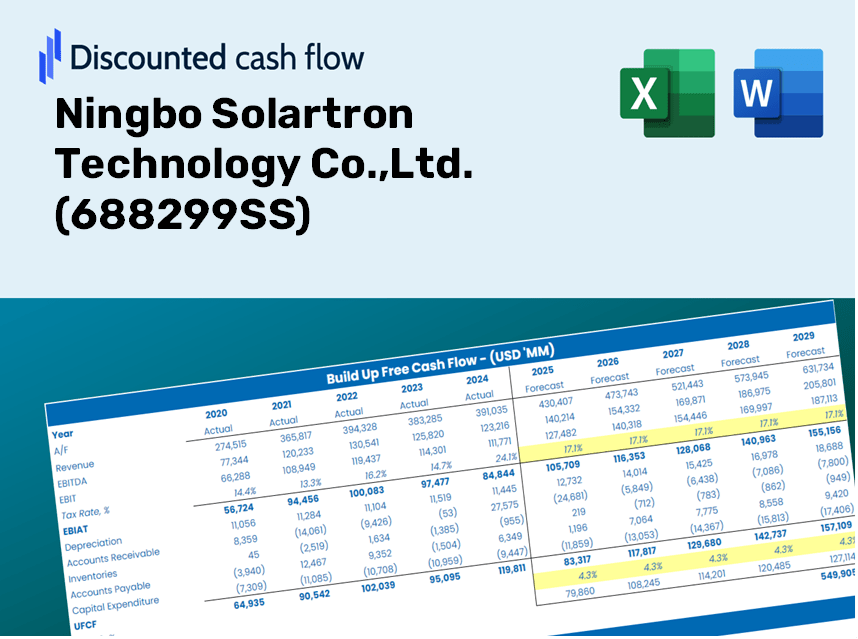
Ningbo Solartron Technology Co.,Ltd. (688299.SS) Bundle
Vous cherchez à déterminer la valeur intrinsèque de Ningbo Solartron Technology Co., Ltd.? Notre calculatrice DCF (688299SS) intègre des données réelles avec des fonctionnalités de personnalisation étendues, vous permettant d'affiner les projections et d'améliorer vos choix d'investissement.
Discounted Cash Flow (DCF) - (USD MM)
| Year | AY1 2020 |
AY2 2021 |
AY3 2022 |
AY4 2023 |
AY5 2024 |
FY1 2025 |
FY2 2026 |
FY3 2027 |
FY4 2028 |
FY5 2029 |
|---|---|---|---|---|---|---|---|---|---|---|
| Revenue | 1,045.0 | 1,296.7 | 1,153.0 | 1,253.3 | 1,336.4 | 1,431.0 | 1,532.3 | 1,640.8 | 1,757.0 | 1,881.4 |
| Revenue Growth, % | 0 | 24.08 | -11.08 | 8.7 | 6.62 | 7.08 | 7.08 | 7.08 | 7.08 | 7.08 |
| EBITDA | 254.6 | 259.8 | 201.7 | 203.7 | 122.6 | 249.9 | 267.6 | 286.5 | 306.8 | 328.6 |
| EBITDA, % | 24.36 | 20.03 | 17.49 | 16.25 | 9.17 | 17.46 | 17.46 | 17.46 | 17.46 | 17.46 |
| Depreciation | 46.1 | 56.7 | 67.3 | 84.3 | 113.4 | 85.4 | 91.4 | 97.9 | 104.8 | 112.2 |
| Depreciation, % | 4.41 | 4.37 | 5.84 | 6.72 | 8.49 | 5.96 | 5.96 | 5.96 | 5.96 | 5.96 |
| EBIT | 208.6 | 203.1 | 134.4 | 119.5 | 9.2 | 164.5 | 176.2 | 188.7 | 202.0 | 216.3 |
| EBIT, % | 19.96 | 15.66 | 11.65 | 9.53 | 0.68645 | 11.5 | 11.5 | 11.5 | 11.5 | 11.5 |
| Total Cash | 730.0 | 718.8 | 426.5 | 387.3 | 286.0 | 614.1 | 657.6 | 704.2 | 754.0 | 807.4 |
| Total Cash, percent | .0 | .0 | .0 | .0 | .0 | .0 | .0 | .0 | .0 | .0 |
| Account Receivables | 453.0 | 514.1 | 511.8 | 616.0 | 660.1 | 646.6 | 692.4 | 741.4 | 793.9 | 850.1 |
| Account Receivables, % | 43.35 | 39.65 | 44.39 | 49.15 | 49.4 | 45.19 | 45.19 | 45.19 | 45.19 | 45.19 |
| Inventories | 87.7 | 168.2 | 212.5 | 272.4 | 260.7 | 231.9 | 248.4 | 265.9 | 284.8 | 304.9 |
| Inventories, % | 8.39 | 12.97 | 18.43 | 21.73 | 19.51 | 16.21 | 16.21 | 16.21 | 16.21 | 16.21 |
| Accounts Payable | 241.3 | 273.3 | 230.6 | 415.6 | 437.0 | 372.1 | 398.5 | 426.7 | 456.9 | 489.3 |
| Accounts Payable, % | 23.09 | 21.08 | 20 | 33.16 | 32.7 | 26.01 | 26.01 | 26.01 | 26.01 | 26.01 |
| Capital Expenditure | -214.0 | -227.2 | -456.1 | -510.8 | -298.3 | -402.5 | -431.0 | -461.5 | -494.2 | -529.2 |
| Capital Expenditure, % | -20.48 | -17.52 | -39.55 | -40.76 | -22.32 | -28.13 | -28.13 | -28.13 | -28.13 | -28.13 |
| Tax Rate, % | -278.17 | -278.17 | -278.17 | -278.17 | -278.17 | -278.17 | -278.17 | -278.17 | -278.17 | -278.17 |
| EBITAT | 180.3 | 187.6 | 113.4 | 98.9 | 34.7 | 146.8 | 157.2 | 168.3 | 180.2 | 193.0 |
| Depreciation | ||||||||||
| Changes in Account Receivables | ||||||||||
| Changes in Inventories | ||||||||||
| Changes in Accounts Payable | ||||||||||
| Capital Expenditure | ||||||||||
| UFCF | -287.1 | -92.5 | -360.0 | -306.9 | -161.1 | -193.0 | -218.3 | -233.7 | -250.3 | -268.0 |
| WACC, % | 5.79 | 5.81 | 5.78 | 5.78 | 5.83 | 5.8 | 5.8 | 5.8 | 5.8 | 5.8 |
| PV UFCF | ||||||||||
| SUM PV UFCF | -976.7 | |||||||||
| Long Term Growth Rate, % | 3.50 | |||||||||
| Free cash flow (T + 1) | -277 | |||||||||
| Terminal Value | -12,063 | |||||||||
| Present Terminal Value | -9,100 | |||||||||
| Enterprise Value | -10,077 | |||||||||
| Net Debt | 224 | |||||||||
| Equity Value | -10,301 | |||||||||
| Diluted Shares Outstanding, MM | 282 | |||||||||
| Equity Value Per Share | -36.49 |
What You Will Receive
- Editable Forecast Parameters: Easily modify assumptions (growth %, margins, WACC) to explore various scenarios.
- Real-World Data: Ningbo Solartron Technology Co.,Ltd.’s financial data pre-loaded to kickstart your analysis.
- Automatic DCF Outputs: The template automatically calculates Net Present Value (NPV) and intrinsic value for you.
- Customizable and Professional: A refined Excel model that adjusts to your valuation requirements.
- Designed for Analysts and Investors: Perfect for evaluating projections, validating strategies, and enhancing efficiency.
Key Features
- Comprehensive Historical Data: Pre-filled with Ningbo Solartron Technology’s (688299SS) past financial performance and future projections.
- Customizable Financial Inputs: Tailor revenue growth rates, profit margins, WACC, tax implications, and capital investments to your preferences.
- Real-Time Valuation Model: Automatically refreshes the Net Present Value (NPV) and intrinsic value based on your customized data.
- Scenario Analysis Tools: Develop various forecasting scenarios to evaluate differing valuation results.
- Intuitive User Interface: Designed to be straightforward and organized, catering to both experienced professionals and newcomers.
How It Works
- Step 1: Download the Excel file.
- Step 2: Review Ningbo Solartron Technology Co., Ltd.'s (688299SS) pre-filled financial data and forecasts.
- Step 3: Adjust key inputs such as revenue growth, WACC, and tax rates (highlighted cells).
- Step 4: Observe the DCF model update in real-time as you modify assumptions.
- Step 5: Analyze the results and apply the findings to your investment strategies.
Why Select Ningbo Solartron Technology Co., Ltd. (688299SS)?
- All-in-One Solution: Combines cutting-edge solar technology with advanced analytics for comprehensive evaluations.
- Flexible Configurations: Modify highlighted parameters to explore different operational scenarios.
- In-Depth Analysis: Automatically computes key metrics such as intrinsic value and Net Present Value for informed decision-making.
- Rich Data Repository: Features both historical and projected data for reliable analysis.
- High Professional Standards: Perfect for industry analysts, investors, and energy consultants seeking excellence.
Who Should Utilize This Product?
- Investment Professionals: Develop comprehensive and accurate valuation models for portfolio assessments of Ningbo Solartron Technology Co., Ltd. (688299SS).
- Corporate Finance Departments: Evaluate valuation scenarios to inform internal strategies and decision-making.
- Consultants and Financial Advisors: Deliver precise valuation insights for clients interested in Ningbo Solartron Technology Co., Ltd. (688299SS).
- Students and Instructors: Employ real-world data to enhance practical skills and teaching in financial modeling.
- Technology Aficionados: Gain insights into how technology firms like Ningbo Solartron Technology Co., Ltd. (688299SS) are valued in the industry.
Contents of the Template
- Preloaded Ningbo Solartron Data: Historical and forecasted financial metrics, including revenue, EBIT, and capital expenditures.
- DCF and WACC Models: Advanced worksheets for determining intrinsic value and Weighted Average Cost of Capital.
- Editable Inputs: Cells highlighted in yellow for modifying revenue growth rates, tax rates, and discount rates.
- Financial Statements: Detailed annual and quarterly financial reports for in-depth analysis.
- Key Ratios: Ratios related to profitability, leverage, and efficiency for performance evaluation.
- Dashboard and Charts: Visual overviews of valuation results and underlying assumptions.
Disclaimer
All information, articles, and product details provided on this website are for general informational and educational purposes only. We do not claim any ownership over, nor do we intend to infringe upon, any trademarks, copyrights, logos, brand names, or other intellectual property mentioned or depicted on this site. Such intellectual property remains the property of its respective owners, and any references here are made solely for identification or informational purposes, without implying any affiliation, endorsement, or partnership.
We make no representations or warranties, express or implied, regarding the accuracy, completeness, or suitability of any content or products presented. Nothing on this website should be construed as legal, tax, investment, financial, medical, or other professional advice. In addition, no part of this site—including articles or product references—constitutes a solicitation, recommendation, endorsement, advertisement, or offer to buy or sell any securities, franchises, or other financial instruments, particularly in jurisdictions where such activity would be unlawful.
All content is of a general nature and may not address the specific circumstances of any individual or entity. It is not a substitute for professional advice or services. Any actions you take based on the information provided here are strictly at your own risk. You accept full responsibility for any decisions or outcomes arising from your use of this website and agree to release us from any liability in connection with your use of, or reliance upon, the content or products found herein.