
|
Chengdu M&S Electronics Technology Co., Ltd. (688311.SS) Évaluation DCF |
Entièrement Modifiable: Adapté À Vos Besoins Dans Excel Ou Sheets
Conception Professionnelle: Modèles Fiables Et Conformes Aux Normes Du Secteur
Pré-Construits Pour Une Utilisation Rapide Et Efficace
Compatible MAC/PC, entièrement débloqué
Aucune Expertise N'Est Requise; Facile À Suivre
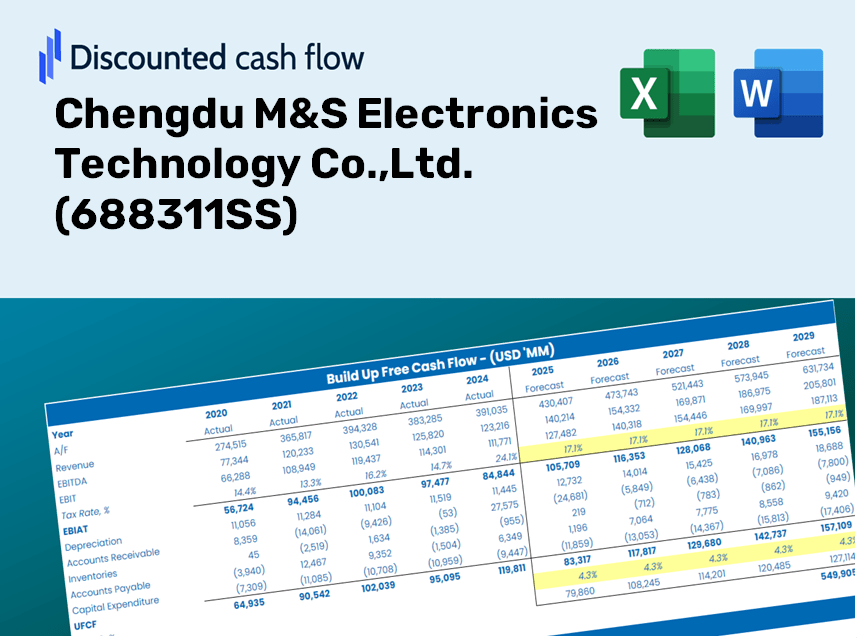
Chengdu M&S Electronics Technology Co.,Ltd. (688311.SS) Bundle
Rationalisez votre analyse et améliorez la précision avec notre calculatrice DCF (688311SS)! En utilisant de véritables données de Chengdu M&S Electronics Technology Co., Ltd. et des hypothèses personnalisables, cet outil vous permet de prévoir, d'analyser et de valoriser Chengdu M&S comme un investisseur chevronné.
Discounted Cash Flow (DCF) - (USD MM)
| Year | AY1 2020 |
AY2 2021 |
AY3 2022 |
AY4 2023 |
AY5 2024 |
FY1 2025 |
FY2 2026 |
FY3 2027 |
FY4 2028 |
FY5 2029 |
|---|---|---|---|---|---|---|---|---|---|---|
| Revenue | 423.2 | 475.8 | 478.9 | 331.3 | 139.4 | 113.0 | 91.6 | 74.3 | 60.2 | 48.8 |
| Revenue Growth, % | 0 | 12.42 | 0.65357 | -30.81 | -57.94 | -18.92 | -18.92 | -18.92 | -18.92 | -18.92 |
| EBITDA | 151.9 | 180.0 | 79.3 | 18.2 | -235.8 | -.9 | -.8 | -.6 | -.5 | -.4 |
| EBITDA, % | 35.89 | 37.84 | 16.57 | 5.5 | -169.23 | -0.83954 | -0.83954 | -0.83954 | -0.83954 | -0.83954 |
| Depreciation | 25.4 | 24.2 | 48.1 | 70.3 | 73.4 | 21.5 | 17.4 | 14.1 | 11.4 | 9.3 |
| Depreciation, % | 6 | 5.08 | 10.05 | 21.23 | 52.68 | 19.01 | 19.01 | 19.01 | 19.01 | 19.01 |
| EBIT | 126.5 | 155.9 | 31.2 | -52.1 | -309.3 | -10.5 | -8.5 | -6.9 | -5.6 | -4.5 |
| EBIT, % | 29.9 | 32.76 | 6.51 | -15.73 | -221.91 | -9.31 | -9.31 | -9.31 | -9.31 | -9.31 |
| Total Cash | 1,043.3 | 914.8 | 576.1 | 598.9 | 333.4 | 113.0 | 91.6 | 74.3 | 60.2 | 48.8 |
| Total Cash, percent | .0 | .0 | .0 | .0 | .0 | .0 | .0 | .0 | .0 | .0 |
| Account Receivables | 489.1 | 603.5 | 663.8 | 635.2 | 534.5 | 113.0 | 91.6 | 74.3 | 60.2 | 48.8 |
| Account Receivables, % | 115.56 | 126.85 | 138.6 | 191.71 | 383.53 | 100 | 100 | 100 | 100 | 100 |
| Inventories | 123.0 | 167.7 | 264.7 | 342.0 | 329.1 | 72.2 | 58.6 | 47.5 | 38.5 | 31.2 |
| Inventories, % | 29.05 | 35.25 | 55.28 | 103.23 | 236.17 | 63.92 | 63.92 | 63.92 | 63.92 | 63.92 |
| Accounts Payable | 222.0 | 278.1 | 406.2 | 389.5 | 270.7 | 89.4 | 72.5 | 58.8 | 47.7 | 38.7 |
| Accounts Payable, % | 52.47 | 58.45 | 84.82 | 117.55 | 194.27 | 79.15 | 79.15 | 79.15 | 79.15 | 79.15 |
| Capital Expenditure | -131.7 | -194.0 | -310.1 | -137.3 | -49.4 | -48.3 | -39.1 | -31.7 | -25.7 | -20.9 |
| Capital Expenditure, % | -31.11 | -40.78 | -64.75 | -41.43 | -35.45 | -42.7 | -42.7 | -42.7 | -42.7 | -42.7 |
| Tax Rate, % | 16.33 | 16.33 | 16.33 | 16.33 | 16.33 | 16.33 | 16.33 | 16.33 | 16.33 | 16.33 |
| EBITAT | 108.0 | 135.4 | 35.9 | -47.2 | -258.8 | -9.4 | -7.6 | -6.2 | -5.0 | -4.1 |
| Depreciation | ||||||||||
| Changes in Account Receivables | ||||||||||
| Changes in Inventories | ||||||||||
| Changes in Accounts Payable | ||||||||||
| Capital Expenditure | ||||||||||
| UFCF | -388.2 | -137.6 | -255.1 | -179.6 | -239.9 | 460.9 | -11.2 | -9.1 | -7.4 | -6.0 |
| WACC, % | 4.78 | 4.78 | 4.82 | 4.79 | 4.77 | 4.79 | 4.79 | 4.79 | 4.79 | 4.79 |
| PV UFCF | ||||||||||
| SUM PV UFCF | 410.9 | |||||||||
| Long Term Growth Rate, % | 2.00 | |||||||||
| Free cash flow (T + 1) | -6 | |||||||||
| Terminal Value | -218 | |||||||||
| Present Terminal Value | -173 | |||||||||
| Enterprise Value | 238 | |||||||||
| Net Debt | -160 | |||||||||
| Equity Value | 398 | |||||||||
| Diluted Shares Outstanding, MM | 160 | |||||||||
| Equity Value Per Share | 2.49 |
What You Will Receive
- Authentic Financial Data for Chengdu M&S Electronics (688311SS): Comprehensive historical and projected figures for precise valuation assessments.
- Customizable Parameters: Adjust inputs such as WACC, tax rates, revenue growth, and capital investments.
- Real-Time Calculations: Dynamic computation of intrinsic value and NPV.
- Scenario Testing: Analyze various scenarios to assess the future performance of Chengdu M&S Electronics.
- User-Friendly Interface: Designed for industry experts but also easy for newcomers to navigate.
Core Features
- Customizable Forecast Assumptions: Adjust essential metrics such as revenue growth, EBITDA margin, and capital expenditures.
- Instant DCF Valuation: Provides quick calculations for intrinsic value, NPV, and additional outputs.
- High-Precision Accuracy: Relies on Chengdu M&S Electronics Technology's (688311SS) actual financial data for dependable valuation results.
- Effortless Scenario Analysis: Easily test various assumptions and effortlessly compare the results.
- Efficiency Booster: Remove the hassle of constructing intricate valuation models from the ground up.
How It Operates
- Step 1: Download the Excel file.
- Step 2: Examine the pre-filled financial data and projections for Chengdu M&S Electronics Technology Co., Ltd. (688311SS).
- Step 3: Adjust key variables such as revenue growth, WACC, and tax rates (highlighted cells).
- Step 4: Observe the DCF model refresh in real-time as you modify your assumptions.
- Step 5: Evaluate the results and leverage the findings for investment choices.
Why Opt for Chengdu M&S Electronics Technology Co., Ltd. (688311SS)?
- Time-Efficient: Skip the hassle of building models from scratch – our tools are pre-configured for your convenience.
- Enhanced Accuracy: Our reliable financial data and formulas help minimize errors in your evaluations.
- Completely Customizable: Adjust the models to align with your unique assumptions and forecasts.
- User-Friendly: Intuitive charts and outputs simplify the analysis of results.
- Preferred by Professionals: Tailored for experts who prioritize precision and ease of use.
Who Can Benefit from This Product?
- Professional Investors: Create comprehensive and trustworthy valuation models for asset evaluation.
- Corporate Finance Teams: Evaluate valuation scenarios to inform strategic decision-making.
- Consultants and Advisors: Equip clients with precise valuation insights for Chengdu M&S Electronics Technology Co.,Ltd. (688311SS).
- Students and Educators: Leverage real-world data to enhance financial modeling skills in teaching and practice.
- Tech Enthusiasts: Gain insights into the market valuation of technology firms like Chengdu M&S Electronics Technology Co.,Ltd.
Contents of the Template
- Preloaded Chengdu M&S Data: Historical and projected financial figures, encompassing revenue, EBIT, and capital expenditures.
- DCF and WACC Models: Professional-caliber spreadsheets designed for calculating intrinsic value and Weighted Average Cost of Capital.
- Editable Inputs: Yellow-highlighted cells allowing adjustments for revenue growth, tax rates, and discount rates.
- Financial Statements: Detailed annual and quarterly financials for comprehensive analysis.
- Key Ratios: Ratios focusing on profitability, leverage, and efficiency to assess performance.
- Dashboard and Charts: Visual representations of valuation results and underlying assumptions.
Disclaimer
All information, articles, and product details provided on this website are for general informational and educational purposes only. We do not claim any ownership over, nor do we intend to infringe upon, any trademarks, copyrights, logos, brand names, or other intellectual property mentioned or depicted on this site. Such intellectual property remains the property of its respective owners, and any references here are made solely for identification or informational purposes, without implying any affiliation, endorsement, or partnership.
We make no representations or warranties, express or implied, regarding the accuracy, completeness, or suitability of any content or products presented. Nothing on this website should be construed as legal, tax, investment, financial, medical, or other professional advice. In addition, no part of this site—including articles or product references—constitutes a solicitation, recommendation, endorsement, advertisement, or offer to buy or sell any securities, franchises, or other financial instruments, particularly in jurisdictions where such activity would be unlawful.
All content is of a general nature and may not address the specific circumstances of any individual or entity. It is not a substitute for professional advice or services. Any actions you take based on the information provided here are strictly at your own risk. You accept full responsibility for any decisions or outcomes arising from your use of this website and agree to release us from any liability in connection with your use of, or reliance upon, the content or products found herein.