
|
Noognene Co., Ltd. (688315.SS) Évaluation DCF |
Entièrement Modifiable: Adapté À Vos Besoins Dans Excel Ou Sheets
Conception Professionnelle: Modèles Fiables Et Conformes Aux Normes Du Secteur
Pré-Construits Pour Une Utilisation Rapide Et Efficace
Compatible MAC/PC, entièrement débloqué
Aucune Expertise N'Est Requise; Facile À Suivre
Novogene Co., Ltd. (688315.SS) Bundle
Simplify Noognene Co., Ltd. (688315SS) Évaluation avec cette calculatrice DCF personnalisable! Doté de Real Nogene Co., Ltd. (688315SS) Financials and Adjustable Prévisions, vous pouvez tester des scénarios et découvrir Noogène Co., Ltd. (688315SS) juste la juste valeur en minutes.
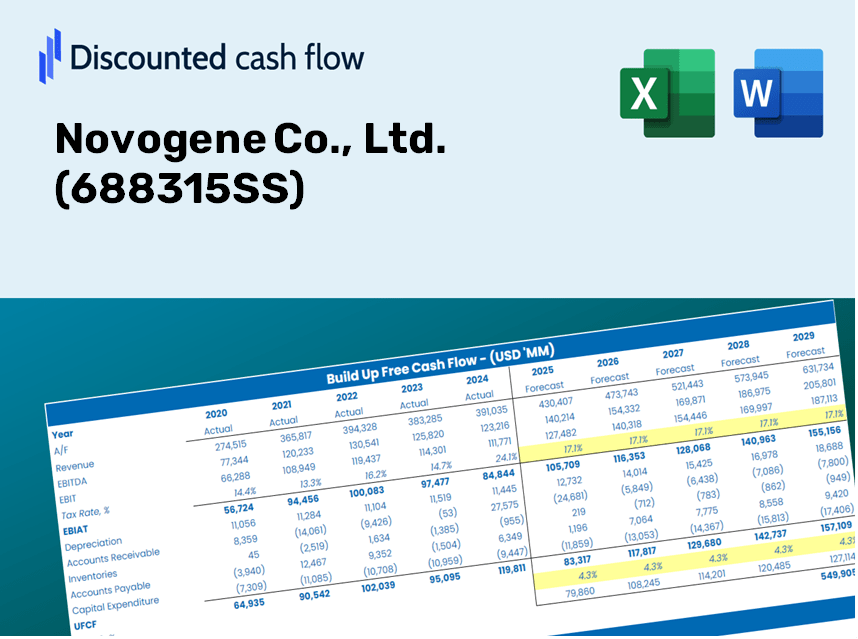
Discounted Cash Flow (DCF) - (USD MM)
| Year | AY1 2020 |
AY2 2021 |
AY3 2022 |
AY4 2023 |
AY5 2024 |
FY1 2025 |
FY2 2026 |
FY3 2027 |
FY4 2028 |
FY5 2029 |
|---|---|---|---|---|---|---|---|---|---|---|
| Revenue | 1,490.0 | 1,866.4 | 1,925.6 | 2,002.1 | 2,111.3 | 2,311.2 | 2,529.9 | 2,769.3 | 3,031.5 | 3,318.4 |
| Revenue Growth, % | 0 | 25.26 | 3.17 | 3.97 | 5.45 | 9.46 | 9.46 | 9.46 | 9.46 | 9.46 |
| EBITDA | 156.3 | 387.8 | 348.5 | 369.4 | 385.2 | 397.8 | 435.4 | 476.7 | 521.8 | 571.1 |
| EBITDA, % | 10.49 | 20.78 | 18.1 | 18.45 | 18.24 | 17.21 | 17.21 | 17.21 | 17.21 | 17.21 |
| Depreciation | 110.5 | 136.7 | 137.8 | 152.5 | 159.2 | 171.2 | 187.4 | 205.2 | 224.6 | 245.9 |
| Depreciation, % | 7.41 | 7.32 | 7.15 | 7.62 | 7.54 | 7.41 | 7.41 | 7.41 | 7.41 | 7.41 |
| EBIT | 45.8 | 251.1 | 210.7 | 216.9 | 226.0 | 226.5 | 248.0 | 271.5 | 297.2 | 325.3 |
| EBIT, % | 3.07 | 13.45 | 10.94 | 10.84 | 10.71 | 9.8 | 9.8 | 9.8 | 9.8 | 9.8 |
| Total Cash | 490.0 | 1,064.1 | 1,042.5 | 1,531.6 | 1,641.1 | 1,378.7 | 1,509.2 | 1,652.0 | 1,808.3 | 1,979.5 |
| Total Cash, percent | .0 | .0 | .0 | .0 | .0 | .0 | .0 | .0 | .0 | .0 |
| Account Receivables | 322.4 | 537.2 | 615.6 | 576.2 | 610.5 | 647.5 | 708.8 | 775.9 | 849.3 | 929.7 |
| Account Receivables, % | 21.64 | 28.78 | 31.97 | 28.78 | 28.91 | 28.02 | 28.02 | 28.02 | 28.02 | 28.02 |
| Inventories | 201.6 | 230.6 | 197.1 | 181.5 | 163.7 | 244.7 | 267.9 | 293.2 | 321.0 | 351.3 |
| Inventories, % | 13.53 | 12.35 | 10.24 | 9.07 | 7.75 | 10.59 | 10.59 | 10.59 | 10.59 | 10.59 |
| Accounts Payable | 158.1 | 238.7 | 131.7 | 159.0 | 179.0 | 215.6 | 236.1 | 258.4 | 282.9 | 309.6 |
| Accounts Payable, % | 10.61 | 12.79 | 6.84 | 7.94 | 8.48 | 9.33 | 9.33 | 9.33 | 9.33 | 9.33 |
| Capital Expenditure | -92.1 | -112.0 | -217.2 | -116.7 | -182.6 | -175.4 | -192.0 | -210.1 | -230.0 | -251.8 |
| Capital Expenditure, % | -6.18 | -6 | -11.28 | -5.83 | -8.65 | -7.59 | -7.59 | -7.59 | -7.59 | -7.59 |
| Tax Rate, % | 12.43 | 12.43 | 12.43 | 12.43 | 12.43 | 12.43 | 12.43 | 12.43 | 12.43 | 12.43 |
| EBITAT | 47.1 | 229.4 | 179.1 | 181.7 | 197.9 | 202.8 | 222.0 | 243.0 | 266.0 | 291.2 |
| Depreciation | ||||||||||
| Changes in Account Receivables | ||||||||||
| Changes in Inventories | ||||||||||
| Changes in Accounts Payable | ||||||||||
| Capital Expenditure | ||||||||||
| UFCF | -300.4 | 91.0 | -52.4 | 299.7 | 178.1 | 117.4 | 153.5 | 168.0 | 183.9 | 201.3 |
| WACC, % | 7.33 | 7.33 | 7.32 | 7.32 | 7.32 | 7.33 | 7.33 | 7.33 | 7.33 | 7.33 |
| PV UFCF | ||||||||||
| SUM PV UFCF | 658.5 | |||||||||
| Long Term Growth Rate, % | 4.00 | |||||||||
| Free cash flow (T + 1) | 209 | |||||||||
| Terminal Value | 6,295 | |||||||||
| Present Terminal Value | 4,421 | |||||||||
| Enterprise Value | 5,079 | |||||||||
| Net Debt | -374 | |||||||||
| Equity Value | 5,453 | |||||||||
| Diluted Shares Outstanding, MM | 410 | |||||||||
| Equity Value Per Share | 13.30 |
What You Will Receive
- Genuine Novogene Financials: Access to both historical and projected data for precise valuation.
- Customizable Parameters: Adjust assumptions like WACC, tax rates, revenue growth, and capital investments.
- Instant Calculations: Intrinsic value and NPV are computed in real-time.
- Comprehensive Scenario Analysis: Evaluate various scenarios to assess Novogene’s potential future performance.
- User-Friendly Design: Designed for experts but easy to navigate for newcomers.
Key Features
- Authentic Novogene Data: Gain access to reliable historical metrics and future trend projections.
- Adjustable Forecast Parameters: Modify highlighted cells for WACC, growth rates, and profit margins.
- Real-Time Calculations: Automatic updates for DCF, Net Present Value (NPV), and cash flow assessments.
- Interactive Dashboard: User-friendly charts and summaries to easily interpret your valuation findings.
- Designed for All Skill Levels: A straightforward, intuitive layout tailored for investors, CFOs, and consultants.
How It Functions
- Obtain the Template: Gain immediate access to the Excel-based Novogene DCF Calculator.
- Enter Your Assumptions: Modify the yellow-highlighted cells for growth rates, WACC, profit margins, and other variables.
- Immediate Calculations: The model automatically recalculates Novogene's intrinsic value.
- Experiment with Scenarios: Test various assumptions to assess potential changes in valuation.
- Evaluate and Decide: Utilize the findings to inform your investment or financial analysis.
Why Opt for This Calculator?
- Reliable Data: Utilize accurate Novogene financials to achieve trustworthy valuation outcomes.
- Adaptable: Modify essential parameters such as growth rates, WACC, and tax rates to align with your forecasts.
- Efficient: Pre-configured calculations save you the hassle of starting from square one.
- Industry-Standard Tool: Crafted for investors, analysts, and consultants focused on Novogene Co., Ltd. (688315SS).
- Easy to Use: The intuitive design and clear step-by-step guidance ensure accessibility for all users.
Who Can Benefit from This Product?
- Genomics Students: Acquire knowledge of genetic sequencing techniques and apply them to real-world datasets.
- Researchers: Integrate advanced genomic models into your studies or experiments.
- Biotech Investors: Evaluate your own hypotheses and analyze market outcomes for Novogene Co., Ltd. (688315SS).
- Data Analysts: Optimize your analysis process with a customizable genomic data model.
- Health Entrepreneurs: Discover how leading biotech companies like Novogene Co., Ltd. (688315SS) conduct their genetic analyses.
Contents of the Template
- In-Depth DCF Model: Editable template featuring detailed valuation computations.
- Current Market Data: Novogene Co., Ltd.'s historical and projected financial figures preloaded for your evaluation.
- Adjustable Assumptions: Modify WACC, growth rates, and tax considerations to explore various scenarios.
- Comprehensive Financial Statements: Complete annual and quarterly analyses for enhanced understanding.
- Essential Ratios: Integrated assessments for profitability, efficiency, and leverage metrics.
- Interactive Dashboard with Visual Data: Graphs and tables providing clear, actionable insights.
Disclaimer
All information, articles, and product details provided on this website are for general informational and educational purposes only. We do not claim any ownership over, nor do we intend to infringe upon, any trademarks, copyrights, logos, brand names, or other intellectual property mentioned or depicted on this site. Such intellectual property remains the property of its respective owners, and any references here are made solely for identification or informational purposes, without implying any affiliation, endorsement, or partnership.
We make no representations or warranties, express or implied, regarding the accuracy, completeness, or suitability of any content or products presented. Nothing on this website should be construed as legal, tax, investment, financial, medical, or other professional advice. In addition, no part of this site—including articles or product references—constitutes a solicitation, recommendation, endorsement, advertisement, or offer to buy or sell any securities, franchises, or other financial instruments, particularly in jurisdictions where such activity would be unlawful.
All content is of a general nature and may not address the specific circumstances of any individual or entity. It is not a substitute for professional advice or services. Any actions you take based on the information provided here are strictly at your own risk. You accept full responsibility for any decisions or outcomes arising from your use of this website and agree to release us from any liability in connection with your use of, or reliance upon, the content or products found herein.