
|
Shenzhen Fortune Trend Technology Co., Ltd. (688318.SS) Évaluation DCF |
Entièrement Modifiable: Adapté À Vos Besoins Dans Excel Ou Sheets
Conception Professionnelle: Modèles Fiables Et Conformes Aux Normes Du Secteur
Pré-Construits Pour Une Utilisation Rapide Et Efficace
Compatible MAC/PC, entièrement débloqué
Aucune Expertise N'Est Requise; Facile À Suivre
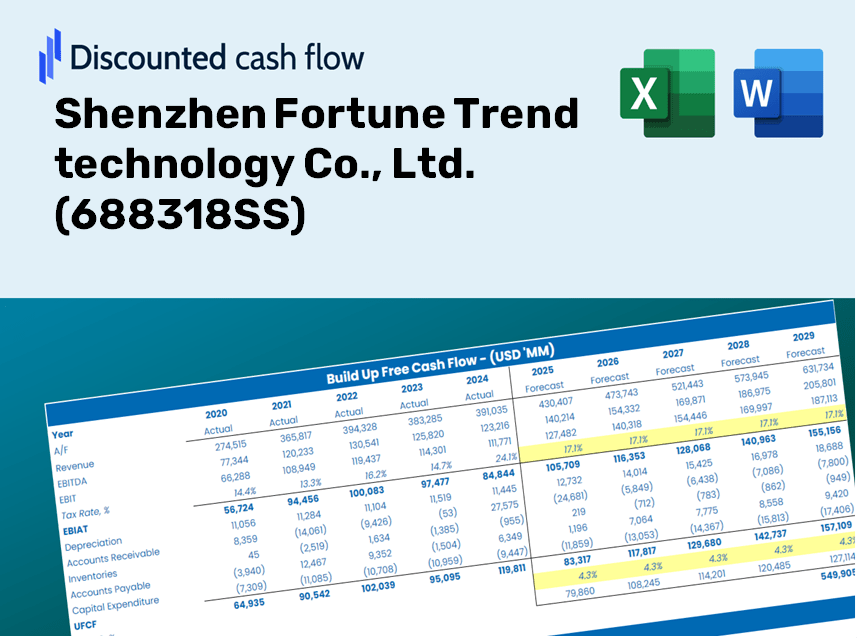
Shenzhen Fortune Trend technology Co., Ltd. (688318.SS) Bundle
Conçu pour la précision, notre calculatrice DCF (688318SS) vous permet d'évaluer l'évaluation de Shenzhen Fortune Trend Technology Co., Ltd. à l'aide de données financières réelles, offrant une flexibilité complète pour modifier tous les paramètres essentiels pour des projections améliorées.
Discounted Cash Flow (DCF) - (USD MM)
| Year | AY1 2020 |
AY2 2021 |
AY3 2022 |
AY4 2023 |
AY5 2024 |
FY1 2025 |
FY2 2026 |
FY3 2027 |
FY4 2028 |
FY5 2029 |
|---|---|---|---|---|---|---|---|---|---|---|
| Revenue | 273.2 | 326.3 | 321.5 | 434.7 | 389.0 | 430.5 | 476.3 | 527.1 | 583.3 | 645.5 |
| Revenue Growth, % | 0 | 19.42 | -1.49 | 35.21 | -10.51 | 10.66 | 10.66 | 10.66 | 10.66 | 10.66 |
| EBITDA | 198.4 | 225.5 | 190.1 | 296.3 | 239.7 | 284.6 | 315.0 | 348.6 | 385.7 | 426.8 |
| EBITDA, % | 72.62 | 69.09 | 59.14 | 68.18 | 61.62 | 66.13 | 66.13 | 66.13 | 66.13 | 66.13 |
| Depreciation | 2.0 | 2.5 | 3.1 | 3.9 | 3.9 | 3.8 | 4.2 | 4.6 | 5.1 | 5.6 |
| Depreciation, % | 0.73756 | 0.75856 | 0.97535 | 0.90318 | 0.99127 | 0.87319 | 0.87319 | 0.87319 | 0.87319 | 0.87319 |
| EBIT | 196.4 | 223.0 | 187.0 | 292.4 | 235.8 | 280.9 | 310.8 | 344.0 | 380.6 | 421.2 |
| EBIT, % | 71.88 | 68.33 | 58.16 | 67.27 | 60.62 | 65.25 | 65.25 | 65.25 | 65.25 | 65.25 |
| Total Cash | 2,382.9 | 739.4 | 2,855.0 | 3,274.3 | 2,077.8 | 430.5 | 476.3 | 527.1 | 583.3 | 645.5 |
| Total Cash, percent | .0 | .0 | .0 | .0 | .0 | .0 | .0 | .0 | .0 | .0 |
| Account Receivables | 32.0 | 40.2 | 72.8 | 49.4 | 46.4 | 60.3 | 66.7 | 73.8 | 81.6 | 90.3 |
| Account Receivables, % | 11.73 | 12.33 | 22.65 | 11.36 | 11.92 | 14 | 14 | 14 | 14 | 14 |
| Inventories | .9 | .4 | 5.3 | 1.9 | .7 | 2.3 | 2.6 | 2.8 | 3.2 | 3.5 |
| Inventories, % | 0.32747 | 0.11683 | 1.64 | 0.42876 | 0.18583 | 0.54067 | 0.54067 | 0.54067 | 0.54067 | 0.54067 |
| Accounts Payable | 1.0 | 2.1 | 1.9 | 13.3 | 34.0 | 11.5 | 12.8 | 14.1 | 15.6 | 17.3 |
| Accounts Payable, % | 0.37743 | 0.65 | 0.57825 | 3.05 | 8.73 | 2.68 | 2.68 | 2.68 | 2.68 | 2.68 |
| Capital Expenditure | -2.5 | -2.3 | -24.6 | -19.6 | -37.6 | -20.2 | -22.3 | -24.7 | -27.4 | -30.3 |
| Capital Expenditure, % | -0.92369 | -0.69685 | -7.65 | -4.51 | -9.67 | -4.69 | -4.69 | -4.69 | -4.69 | -4.69 |
| Tax Rate, % | 11.03 | 11.03 | 11.03 | 11.03 | 11.03 | 11.03 | 11.03 | 11.03 | 11.03 | 11.03 |
| EBITAT | 169.6 | 192.2 | 167.9 | 254.3 | 209.8 | 246.2 | 272.5 | 301.5 | 333.6 | 369.2 |
| Depreciation | ||||||||||
| Changes in Account Receivables | ||||||||||
| Changes in Inventories | ||||||||||
| Changes in Accounts Payable | ||||||||||
| Capital Expenditure | ||||||||||
| UFCF | 137.2 | 185.9 | 108.7 | 276.9 | 200.9 | 191.9 | 248.8 | 275.4 | 304.7 | 337.2 |
| WACC, % | 9.94 | 9.94 | 9.94 | 9.94 | 9.94 | 9.94 | 9.94 | 9.94 | 9.94 | 9.94 |
| PV UFCF | ||||||||||
| SUM PV UFCF | 1,006.2 | |||||||||
| Long Term Growth Rate, % | 4.00 | |||||||||
| Free cash flow (T + 1) | 351 | |||||||||
| Terminal Value | 5,908 | |||||||||
| Present Terminal Value | 3,679 | |||||||||
| Enterprise Value | 4,685 | |||||||||
| Net Debt | -512 | |||||||||
| Equity Value | 5,197 | |||||||||
| Diluted Shares Outstanding, MM | 183 | |||||||||
| Equity Value Per Share | 28.41 |
What You Will Receive
- Real SFTT Financial Data: Pre-filled with Shenzhen Fortune Trend Technology Co., Ltd.'s historical and projected data for accurate analysis.
- Completely Customizable Template: Easily adjust key metrics such as revenue growth, WACC, and EBITDA %.
- Instant Calculations: Watch as the intrinsic value of SFTT updates in real-time with your modifications.
- Professional Valuation Tool: Tailored for investors, analysts, and consultants looking for precise DCF results.
- User-Friendly Interface: Intuitive layout and straightforward instructions suitable for all skill levels.
Key Features
- Real-Time 688318SS Data: Equipped with Shenzhen Fortune Trend's historical performance metrics and future forecasts.
- Comprehensive Customization: Tailor inputs for revenue growth, profit margins, discount rates, tax implications, and capital investments.
- Interactive Valuation Model: Automatically recalculates Net Present Value (NPV) and intrinsic value based on your adjustments.
- What-If Analysis: Develop various forecast scenarios to examine different valuation possibilities.
- Intuitive Interface: Organized and accessible design suitable for both seasoned professionals and newcomers.
How It Works
- Step 1: Download the Excel file.
- Step 2: Review Shenzhen Fortune Trend Technology Co., Ltd.'s pre-filled financial data and forecasts.
- Step 3: Adjust key inputs such as revenue growth, WACC, and tax rates (highlighted cells).
- Step 4: Observe the DCF model update in real-time as you modify your assumptions.
- Step 5: Evaluate the outputs and leverage the results for your investment strategies.
Why Opt for Shenzhen Fortune Trend Technology Co., Ltd. (688318SS)?
- Precision: Leveraging real financial data for enhanced accuracy.
- Versatility: Tailored for users to easily adjust and experiment with inputs.
- Efficiency: Eliminate the need to create complex models from the ground up.
- High Standards: Crafted with the expertise and usability expected at the CFO level.
- Intuitive Design: Simple to navigate, making it accessible for users of all experience levels.
Who Can Benefit from Shenzhen Fortune Trend Technology Co., Ltd. (688318SS)?
- Investors: Empower your investment strategies with a high-quality valuation tool tailored for informed decision-making.
- Financial Analysts: Streamline your analysis process with a customizable DCF model that saves you valuable time.
- Consultants: Effortlessly modify the template for impactful client presentations and detailed reports.
- Finance Enthusiasts: Enhance your knowledge of valuation methodologies through practical, real-world case studies.
- Educators and Students: Utilize this resource as an effective educational tool for finance courses and workshops.
Contents of the Template
- Pre-Filled Data: Contains Shenzhen Fortune Trend Technology Co., Ltd.'s historical financial information and projections.
- Discounted Cash Flow Model: An editable DCF valuation model featuring automated calculations.
- Weighted Average Cost of Capital (WACC): A dedicated worksheet for calculating WACC using customized inputs.
- Key Financial Ratios: Insights into Shenzhen Fortune Trend’s profitability, efficiency, and leverage metrics.
- Customizable Inputs: Easily modify revenue growth, profit margins, and tax rates.
- Clear Dashboard: Visuals including charts and tables that present key valuation findings.
Disclaimer
All information, articles, and product details provided on this website are for general informational and educational purposes only. We do not claim any ownership over, nor do we intend to infringe upon, any trademarks, copyrights, logos, brand names, or other intellectual property mentioned or depicted on this site. Such intellectual property remains the property of its respective owners, and any references here are made solely for identification or informational purposes, without implying any affiliation, endorsement, or partnership.
We make no representations or warranties, express or implied, regarding the accuracy, completeness, or suitability of any content or products presented. Nothing on this website should be construed as legal, tax, investment, financial, medical, or other professional advice. In addition, no part of this site—including articles or product references—constitutes a solicitation, recommendation, endorsement, advertisement, or offer to buy or sell any securities, franchises, or other financial instruments, particularly in jurisdictions where such activity would be unlawful.
All content is of a general nature and may not address the specific circumstances of any individual or entity. It is not a substitute for professional advice or services. Any actions you take based on the information provided here are strictly at your own risk. You accept full responsibility for any decisions or outcomes arising from your use of this website and agree to release us from any liability in connection with your use of, or reliance upon, the content or products found herein.