
|
Shenzhen Chipscreen Biosciences Co., Ltd. (688321.SS) Valation DCF |
Entièrement Modifiable: Adapté À Vos Besoins Dans Excel Ou Sheets
Conception Professionnelle: Modèles Fiables Et Conformes Aux Normes Du Secteur
Pré-Construits Pour Une Utilisation Rapide Et Efficace
Compatible MAC/PC, entièrement débloqué
Aucune Expertise N'Est Requise; Facile À Suivre
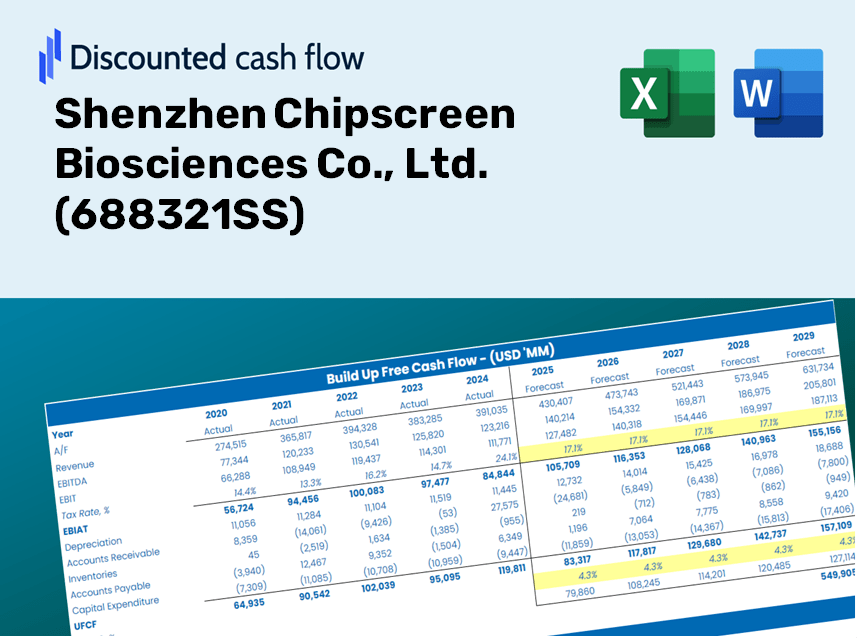
Shenzhen Chipscreen Biosciences Co., Ltd. (688321.SS) Bundle
Explorez les perspectives financières de Shenzhen ChipScreen Biosciences Co., Ltd. (688321SS) avec notre calculatrice DCF conviviale! Entrez vos hypothèses concernant la croissance, les marges et les dépenses pour calculer la valeur intrinsèque de Shenzhen ChipScreen Biosciences Co., Ltd. (688321SS) et affinez votre approche d'investissement.
Discounted Cash Flow (DCF) - (USD MM)
| Year | AY1 2020 |
AY2 2021 |
AY3 2022 |
AY4 2023 |
AY5 2024 |
FY1 2025 |
FY2 2026 |
FY3 2027 |
FY4 2028 |
FY5 2029 |
|---|---|---|---|---|---|---|---|---|---|---|
| Revenue | 269.5 | 430.4 | 529.9 | 523.7 | 657.9 | 834.5 | 1,058.3 | 1,342.2 | 1,702.3 | 2,159.0 |
| Revenue Growth, % | 0 | 59.74 | 23.11 | -1.18 | 25.63 | 26.83 | 26.83 | 26.83 | 26.83 | 26.83 |
| EBITDA | 7.9 | .6 | 42.8 | -141.8 | -3.9 | -27.6 | -35.0 | -44.4 | -56.3 | -71.4 |
| EBITDA, % | 2.94 | 0.13789 | 8.07 | -27.08 | -0.60012 | -3.31 | -3.31 | -3.31 | -3.31 | -3.31 |
| Depreciation | 11.1 | 13.6 | 36.9 | 42.0 | 56.6 | 51.5 | 65.4 | 82.9 | 105.1 | 133.3 |
| Depreciation, % | 4.11 | 3.17 | 6.97 | 8.02 | 8.61 | 6.18 | 6.18 | 6.18 | 6.18 | 6.18 |
| EBIT | -3.1 | -13.0 | 5.8 | -183.9 | -60.6 | -79.1 | -100.4 | -127.3 | -161.4 | -204.7 |
| EBIT, % | -1.17 | -3.03 | 1.1 | -35.11 | -9.21 | -9.48 | -9.48 | -9.48 | -9.48 | -9.48 |
| Total Cash | 580.6 | 382.2 | 799.7 | 850.1 | 469.4 | 767.9 | 973.9 | 1,235.2 | 1,566.6 | 1,986.9 |
| Total Cash, percent | .0 | .0 | .0 | .0 | .0 | .0 | .0 | .0 | .0 | .0 |
| Account Receivables | 41.5 | 122.9 | 154.8 | 221.5 | 178.4 | 237.9 | 301.8 | 382.7 | 485.4 | 615.6 |
| Account Receivables, % | 15.38 | 28.56 | 29.21 | 42.3 | 27.11 | 28.51 | 28.51 | 28.51 | 28.51 | 28.51 |
| Inventories | 12.4 | 15.4 | 28.5 | 47.1 | 40.8 | 48.0 | 60.9 | 77.2 | 97.9 | 124.1 |
| Inventories, % | 4.6 | 3.57 | 5.37 | 9 | 6.21 | 5.75 | 5.75 | 5.75 | 5.75 | 5.75 |
| Accounts Payable | 3.5 | 2.2 | .3 | 9.0 | 2.2 | 6.6 | 8.4 | 10.6 | 13.4 | 17.1 |
| Accounts Payable, % | 1.31 | 0.51824 | 0.06105018 | 1.72 | 0.33247 | 0.78985 | 0.78985 | 0.78985 | 0.78985 | 0.78985 |
| Capital Expenditure | -336.3 | -288.5 | -400.2 | -229.0 | -268.5 | -545.8 | -692.3 | -878.0 | -1,113.5 | -1,412.3 |
| Capital Expenditure, % | -124.79 | -67.01 | -75.51 | -43.73 | -40.81 | -65.41 | -65.41 | -65.41 | -65.41 | -65.41 |
| Tax Rate, % | -18.47 | -18.47 | -18.47 | -18.47 | -18.47 | -18.47 | -18.47 | -18.47 | -18.47 | -18.47 |
| EBITAT | -2.7 | -15.4 | 6.7 | -168.4 | -71.8 | -75.6 | -95.8 | -121.5 | -154.1 | -195.5 |
| Depreciation | ||||||||||
| Changes in Account Receivables | ||||||||||
| Changes in Inventories | ||||||||||
| Changes in Accounts Payable | ||||||||||
| Capital Expenditure | ||||||||||
| UFCF | -378.2 | -376.0 | -403.4 | -432.0 | -241.0 | -632.1 | -797.7 | -1,011.7 | -1,283.1 | -1,627.3 |
| WACC, % | 6.26 | 6.31 | 6.31 | 6.28 | 6.31 | 6.3 | 6.3 | 6.3 | 6.3 | 6.3 |
| PV UFCF | ||||||||||
| SUM PV UFCF | -4,347.2 | |||||||||
| Long Term Growth Rate, % | 2.00 | |||||||||
| Free cash flow (T + 1) | -1,660 | |||||||||
| Terminal Value | -38,629 | |||||||||
| Present Terminal Value | -28,465 | |||||||||
| Enterprise Value | -32,812 | |||||||||
| Net Debt | 821 | |||||||||
| Equity Value | -33,633 | |||||||||
| Diluted Shares Outstanding, MM | 408 | |||||||||
| Equity Value Per Share | -82.43 |
What You Will Receive
- Customizable Excel Template: A fully adjustable Excel-based DCF Calculator featuring pre-filled financial data for Shenzhen Chipscreen Biosciences Co., Ltd. (688321SS).
- Accurate Financial Data: Historical performance metrics and forward-looking projections (highlighted in the yellow cells).
- Adaptable Forecasting: Modify key assumptions such as revenue growth, EBITDA %, and WACC to fit your analysis.
- Instant Calculations: Quickly visualize the effects of your inputs on the valuation of Shenzhen Chipscreen Biosciences Co., Ltd. (688321SS).
- Professional Grade Tool: Designed for use by investors, CFOs, consultants, and financial analysts.
- Intuitive Layout: Organized for easy understanding and usage, complete with step-by-step guidance.
Key Features
- Comprehensive DCF Calculator: Features detailed unlevered and levered DCF valuation models tailored for Shenzhen Chipscreen Biosciences Co., Ltd. (688321SS).
- Customizable WACC Calculator: Pre-built Weighted Average Cost of Capital worksheet with flexible input options.
- Edit Forecast Assumptions: Adjust growth rates, capital expenditures, and discount rates to suit your analysis.
- Integrated Financial Ratios: Evaluate profitability, leverage, and efficiency ratios specific to Shenzhen Chipscreen Biosciences Co., Ltd. (688321SS).
- Interactive Dashboard and Charts: Visual summaries of key valuation metrics for straightforward analysis.
How It Functions
- Step 1: Download the Excel file.
- Step 2: Examine Chipscreen Biosciences' pre-filled financial data and projections.
- Step 3: Adjust key inputs such as revenue growth, WACC, and tax rates (highlighted cells).
- Step 4: Observe the DCF model refresh in real-time as you modify your assumptions.
- Step 5: Evaluate the outputs and leverage the results for investment decisions regarding Chipscreen Biosciences (688321SS).
Why Select This Calculator?
- Designed for Experts: A sophisticated tool utilized by analysts, financial officers, and consultants.
- Comprehensive Data: Chipscreen's historical and projected financial information preloaded for precision.
- Scenario Analysis: Effortlessly simulate various forecasts and assumptions.
- Clear Results: Instantly computes intrinsic value, NPV, and essential metrics.
- User-Friendly: Guided step-by-step instructions simplify the entire process.
Who Can Benefit from This Product?
- Investors: Assess Shenzhen Chipscreen Biosciences Co., Ltd.'s (688321SS) valuation before making stock transactions.
- CFOs and Financial Analysts: Enhance valuation workflows and evaluate financial forecasts.
- Startup Founders: Understand the valuation methods of prominent companies like Shenzhen Chipscreen Biosciences Co., Ltd.
- Consultants: Provide expert valuation reports tailored for clients.
- Students and Educators: Utilize current data to practice and teach valuation methodologies.
What the Template Includes
- Preloaded 688321SS Data: Historical and forecasted financial information, such as revenue, EBIT, and capital expenditures.
- DCF and WACC Models: High-quality templates designed for calculating intrinsic value and Weighted Average Cost of Capital.
- Editable Inputs: Cells highlighted in yellow for modifying revenue growth, tax rates, and discount rates.
- Financial Statements: Detailed annual and quarterly financial reports for in-depth analysis.
- Key Ratios: Metrics for assessing profitability, leverage, and efficiency.
- Dashboard and Charts: Visual representations of valuation results and underlying assumptions.
Disclaimer
All information, articles, and product details provided on this website are for general informational and educational purposes only. We do not claim any ownership over, nor do we intend to infringe upon, any trademarks, copyrights, logos, brand names, or other intellectual property mentioned or depicted on this site. Such intellectual property remains the property of its respective owners, and any references here are made solely for identification or informational purposes, without implying any affiliation, endorsement, or partnership.
We make no representations or warranties, express or implied, regarding the accuracy, completeness, or suitability of any content or products presented. Nothing on this website should be construed as legal, tax, investment, financial, medical, or other professional advice. In addition, no part of this site—including articles or product references—constitutes a solicitation, recommendation, endorsement, advertisement, or offer to buy or sell any securities, franchises, or other financial instruments, particularly in jurisdictions where such activity would be unlawful.
All content is of a general nature and may not address the specific circumstances of any individual or entity. It is not a substitute for professional advice or services. Any actions you take based on the information provided here are strictly at your own risk. You accept full responsibility for any decisions or outcomes arising from your use of this website and agree to release us from any liability in connection with your use of, or reliance upon, the content or products found herein.