
|
Wuxi Autowell Technology Co., Ltd. (688516.SS) Évaluation DCF |
Entièrement Modifiable: Adapté À Vos Besoins Dans Excel Ou Sheets
Conception Professionnelle: Modèles Fiables Et Conformes Aux Normes Du Secteur
Pré-Construits Pour Une Utilisation Rapide Et Efficace
Compatible MAC/PC, entièrement débloqué
Aucune Expertise N'Est Requise; Facile À Suivre
Wuxi Autowell Technology Co.,Ltd. (688516.SS) Bundle
Simplifier Wuxi Autowell Technology Co., Ltd. Valation avec cette calculatrice DCF personnalisable! Avec Real Wuxi Autowell Technology Co., Ltd. Financials and Adjustable Forecast Intarts, vous pouvez tester des scénarios et découvrir Wuxi Autowell Technology Co., Ltd. FAIT VALUE EN MINUTÉ.
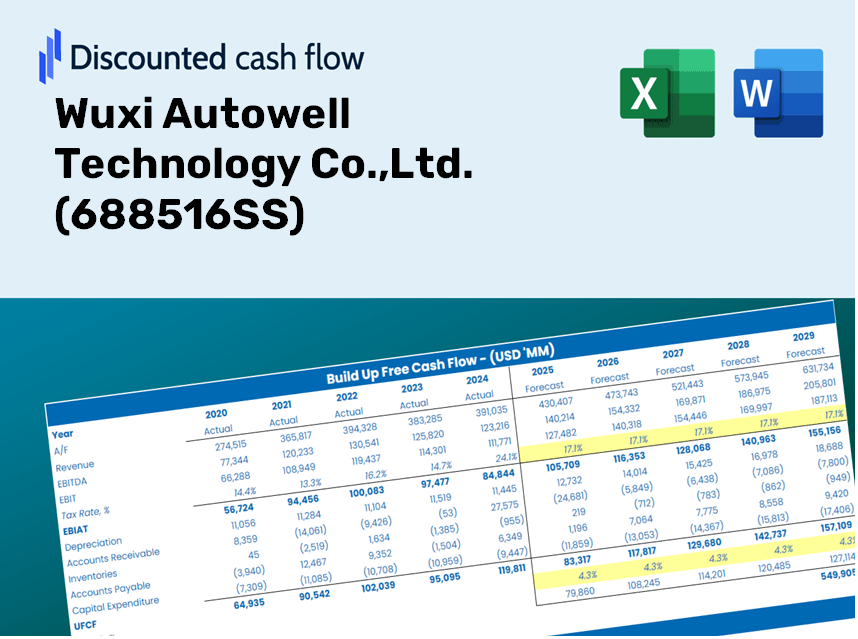
Discounted Cash Flow (DCF) - (USD MM)
| Year | AY1 2020 |
AY2 2021 |
AY3 2022 |
AY4 2023 |
AY5 2024 |
FY1 2025 |
FY2 2026 |
FY3 2027 |
FY4 2028 |
FY5 2029 |
|---|---|---|---|---|---|---|---|---|---|---|
| Revenue | 1,143.9 | 2,046.7 | 3,539.6 | 6,302.2 | 9,197.6 | 15,540.8 | 26,258.5 | 44,367.7 | 74,966.0 | 126,666.4 |
| Revenue Growth, % | 0 | 78.93 | 72.94 | 78.05 | 45.94 | 68.97 | 68.97 | 68.97 | 68.97 | 68.97 |
| EBITDA | 174.5 | 412.5 | 797.5 | 1,506.2 | 1,658.4 | 3,104.1 | 5,244.8 | 8,861.9 | 14,973.5 | 25,300.0 |
| EBITDA, % | 15.25 | 20.15 | 22.53 | 23.9 | 18.03 | 19.97 | 19.97 | 19.97 | 19.97 | 19.97 |
| Depreciation | 7.5 | 8.9 | 25.4 | 55.9 | 83.9 | 112.4 | 189.9 | 320.8 | 542.0 | 915.9 |
| Depreciation, % | 0.65981 | 0.43646 | 0.71885 | 0.88776 | 0.91236 | 0.72305 | 0.72305 | 0.72305 | 0.72305 | 0.72305 |
| EBIT | 166.9 | 403.6 | 772.1 | 1,450.3 | 1,574.5 | 2,991.7 | 5,055.0 | 8,541.1 | 14,431.5 | 24,384.2 |
| EBIT, % | 14.59 | 19.72 | 21.81 | 23.01 | 17.12 | 19.25 | 19.25 | 19.25 | 19.25 | 19.25 |
| Total Cash | 714.8 | 799.7 | 1,680.8 | 2,845.0 | 2,489.4 | 6,876.8 | 11,619.4 | 19,632.7 | 33,172.4 | 56,049.8 |
| Total Cash, percent | .0 | .0 | .0 | .0 | .0 | .0 | .0 | .0 | .0 | .0 |
| Account Receivables | 703.2 | 1,080.2 | 1,864.9 | 3,136.4 | 3,577.3 | 7,944.3 | 13,423.1 | 22,680.3 | 38,321.8 | 64,750.5 |
| Account Receivables, % | 61.47 | 52.77 | 52.69 | 49.77 | 38.89 | 51.12 | 51.12 | 51.12 | 51.12 | 51.12 |
| Inventories | 1,281.7 | 1,851.5 | 3,888.0 | 7,629.6 | 5,341.1 | 13,941.1 | 23,555.7 | 39,800.9 | 67,249.6 | 113,628.3 |
| Inventories, % | 112.05 | 90.46 | 109.84 | 121.06 | 58.07 | 89.71 | 89.71 | 89.71 | 89.71 | 89.71 |
| Accounts Payable | 789.8 | 986.9 | 2,581.9 | 5,577.6 | 3,822.1 | 9,954.4 | 16,819.5 | 28,419.1 | 48,018.3 | 81,134.2 |
| Accounts Payable, % | 69.05 | 48.22 | 72.94 | 88.5 | 41.55 | 64.05 | 64.05 | 64.05 | 64.05 | 64.05 |
| Capital Expenditure | -122.4 | -193.6 | -256.8 | -557.9 | -685.8 | -1,359.1 | -2,296.4 | -3,880.1 | -6,556.0 | -11,077.4 |
| Capital Expenditure, % | -10.7 | -9.46 | -7.26 | -8.85 | -7.46 | -8.75 | -8.75 | -8.75 | -8.75 | -8.75 |
| Tax Rate, % | 18.19 | 18.19 | 18.19 | 18.19 | 18.19 | 18.19 | 18.19 | 18.19 | 18.19 | 18.19 |
| EBITAT | 144.9 | 357.8 | 692.3 | 1,232.8 | 1,288.1 | 2,584.6 | 4,367.1 | 7,378.8 | 12,467.6 | 21,066.0 |
| Depreciation | ||||||||||
| Changes in Account Receivables | ||||||||||
| Changes in Inventories | ||||||||||
| Changes in Accounts Payable | ||||||||||
| Capital Expenditure | ||||||||||
| UFCF | -1,165.0 | -576.7 | -765.3 | -1,286.5 | 778.3 | -5,496.8 | -5,967.7 | -10,083.3 | -17,037.3 | -28,787.1 |
| WACC, % | 5.89 | 5.9 | 5.91 | 5.88 | 5.86 | 5.89 | 5.89 | 5.89 | 5.89 | 5.89 |
| PV UFCF | ||||||||||
| SUM PV UFCF | -54,186.4 | |||||||||
| Long Term Growth Rate, % | 4.00 | |||||||||
| Free cash flow (T + 1) | -29,939 | |||||||||
| Terminal Value | -1,586,574 | |||||||||
| Present Terminal Value | -1,191,920 | |||||||||
| Enterprise Value | -1,246,107 | |||||||||
| Net Debt | 836 | |||||||||
| Equity Value | -1,246,943 | |||||||||
| Diluted Shares Outstanding, MM | 327 | |||||||||
| Equity Value Per Share | -3,810.68 |
Benefits You Will Receive
- Pre-Populated Financial Model: Utilize Wuxi Autowell Technology Co., Ltd.'s actual data for accurate DCF valuation.
- Comprehensive Forecast Control: Modify revenue growth, profit margins, WACC, and other essential factors.
- Real-Time Calculations: Instant updates allow you to view results immediately as you make adjustments.
- Investor-Ready Template: A polished Excel file crafted for high-quality valuation.
- Flexible and Reusable: Designed for adaptability, making it suitable for repeated use in detailed forecasting.
核心特点
- 真实的财务数据: 访问准确的预加载历史数据和未来预测。
- 可自定义的预测假设: 编辑标记为黄色的单元格,例如加权平均资本成本(WACC)、增长率和利润率。
- 动态计算: DCF、净现值(NPV)和现金流分析的自动更新。
- 可视化仪表板: 易于阅读的图表和摘要,帮助您直观展示估值结果。
- 适合专业人士和初学者: 简单直观的结构,专为投资者、首席财务官和顾问设计。
How It Works
- Step 1: Download the Excel file for Wuxi Autowell Technology Co., Ltd. (688516SS).
- Step 2: Examine the pre-filled financial data and forecasts for Wuxi Autowell.
- Step 3: Adjust key inputs such as revenue growth, WACC, and tax rates (highlighted cells).
- Step 4: Observe the DCF model update in real-time as you modify your assumptions.
- Step 5: Evaluate the outputs and leverage the findings for your investment strategies.
Why Opt for This Calculator?
- Designed for Experts: A sophisticated tool tailored for analysts, CFOs, and consultants in the industry.
- Genuine Insights: Wuxi Autowell Technology's (688516SS) historical and forecasted financial data is preloaded for your convenience.
- Flexible Scenario Analysis: Effortlessly explore various projections and assumptions.
- Comprehensive Outputs: Instantly computes intrinsic value, NPV, and essential financial metrics.
- User-Friendly Interface: Detailed instructions provide a seamless experience throughout the calculation process.
Who Should Consider Using This Product?
- Institutional Investors: Develop comprehensive and accurate valuation models for assessing portfolio performance of Wuxi Autowell Technology Co., Ltd. (688516SS).
- Corporate Financial Departments: Evaluate different valuation scenarios to inform strategic decisions within the organization.
- Financial Consultants and Advisors: Equip clients with precise valuation insights pertaining to Wuxi Autowell Technology Co., Ltd. (688516SS).
- Academics and Students: Utilize real-world financial data to enhance learning and practice in financial modeling.
- Technology Enthusiasts: Gain insights into the market valuation of innovative companies like Wuxi Autowell Technology Co., Ltd. (688516SS).
Contents of the Template
- Pre-Filled DCF Model: Wuxi Autowell Technology Co., Ltd.'s (688516SS) financial data preloaded for immediate use.
- WACC Calculator: Comprehensive calculations for the Weighted Average Cost of Capital.
- Financial Ratios: Analyze Wuxi Autowell's profitability, leverage, and operational efficiency.
- Editable Inputs: Modify assumptions such as growth rates, profit margins, and CAPEX to suit your analyses.
- Financial Statements: Access annual and quarterly reports for in-depth evaluation.
- Interactive Dashboard: Effortlessly visualize essential valuation metrics and outcomes.
Disclaimer
All information, articles, and product details provided on this website are for general informational and educational purposes only. We do not claim any ownership over, nor do we intend to infringe upon, any trademarks, copyrights, logos, brand names, or other intellectual property mentioned or depicted on this site. Such intellectual property remains the property of its respective owners, and any references here are made solely for identification or informational purposes, without implying any affiliation, endorsement, or partnership.
We make no representations or warranties, express or implied, regarding the accuracy, completeness, or suitability of any content or products presented. Nothing on this website should be construed as legal, tax, investment, financial, medical, or other professional advice. In addition, no part of this site—including articles or product references—constitutes a solicitation, recommendation, endorsement, advertisement, or offer to buy or sell any securities, franchises, or other financial instruments, particularly in jurisdictions where such activity would be unlawful.
All content is of a general nature and may not address the specific circumstances of any individual or entity. It is not a substitute for professional advice or services. Any actions you take based on the information provided here are strictly at your own risk. You accept full responsibility for any decisions or outcomes arising from your use of this website and agree to release us from any liability in connection with your use of, or reliance upon, the content or products found herein.