
|
Everdisplay Optronics Co., Ltd. (688538.SS) Valation DCF |
Entièrement Modifiable: Adapté À Vos Besoins Dans Excel Ou Sheets
Conception Professionnelle: Modèles Fiables Et Conformes Aux Normes Du Secteur
Pré-Construits Pour Une Utilisation Rapide Et Efficace
Compatible MAC/PC, entièrement débloqué
Aucune Expertise N'Est Requise; Facile À Suivre
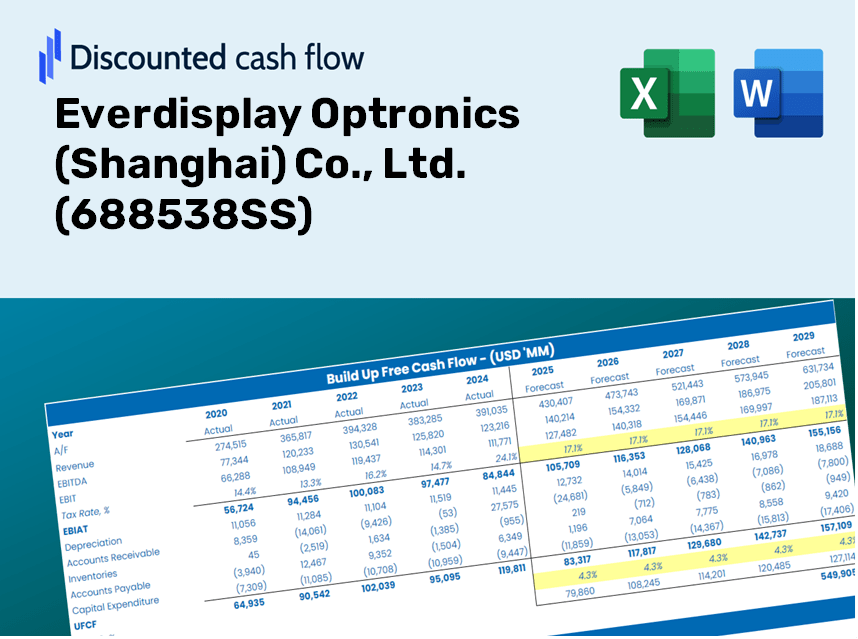
Everdisplay Optronics (Shanghai) Co., Ltd. (688538.SS) Bundle
Gardez un aperçu de votre analyse d'évaluation de votre EverDisplay Optronics (Shanghai) Co., Ltd. (688538SS) avec notre calculatrice sophistiquée DCF! Ce modèle Excel est préchargé avec des données réelles (688538SS), vous permettant d'ajuster les prévisions et les hypothèses pour déterminer avec précision la valeur intrinsèque d'EverDisplay Optronics (Shanghai) Co., Ltd.
Discounted Cash Flow (DCF) - (USD MM)
| Year | AY1 2020 |
AY2 2021 |
AY3 2022 |
AY4 2023 |
AY5 2024 |
FY1 2025 |
FY2 2026 |
FY3 2027 |
FY4 2028 |
FY5 2029 |
|---|---|---|---|---|---|---|---|---|---|---|
| Revenue | 2,502.1 | 4,020.5 | 4,190.9 | 3,038.4 | 4,958.3 | 6,205.5 | 7,766.4 | 9,719.9 | 12,164.8 | 15,224.6 |
| Revenue Growth, % | 0 | 60.69 | 4.24 | -27.5 | 63.19 | 25.15 | 25.15 | 25.15 | 25.15 | 25.15 |
| EBITDA | -10.3 | 89.5 | 62.6 | -1,024.9 | -19.7 | -382.5 | -478.7 | -599.2 | -749.9 | -938.5 |
| EBITDA, % | -0.41227 | 2.23 | 1.49 | -33.73 | -0.39707 | -6.16 | -6.16 | -6.16 | -6.16 | -6.16 |
| Depreciation | 896.6 | 1,022.3 | 1,466.8 | 1,713.0 | 1,901.5 | 2,370.4 | 2,966.6 | 3,712.8 | 4,646.8 | 5,815.6 |
| Depreciation, % | 35.84 | 25.43 | 35 | 56.38 | 38.35 | 38.2 | 38.2 | 38.2 | 38.2 | 38.2 |
| EBIT | -907.0 | -932.9 | -1,404.2 | -2,737.9 | -1,921.2 | -2,752.9 | -3,445.4 | -4,312.0 | -5,396.6 | -6,754.1 |
| EBIT, % | -36.25 | -23.2 | -33.51 | -90.11 | -38.75 | -44.36 | -44.36 | -44.36 | -44.36 | -44.36 |
| Total Cash | 1,420.5 | 7,896.1 | 3,422.5 | 1,937.1 | 3,800.0 | 4,701.7 | 5,884.3 | 7,364.4 | 9,216.9 | 11,535.2 |
| Total Cash, percent | .0 | .0 | .0 | .0 | .0 | .0 | .0 | .0 | .0 | .0 |
| Account Receivables | 272.2 | 1,091.2 | 609.3 | 361.2 | 766.4 | 991.6 | 1,241.1 | 1,553.2 | 1,943.9 | 2,432.9 |
| Account Receivables, % | 10.88 | 27.14 | 14.54 | 11.89 | 15.46 | 15.98 | 15.98 | 15.98 | 15.98 | 15.98 |
| Inventories | 765.8 | 1,002.8 | 1,488.6 | 861.0 | 832.1 | 1,690.2 | 2,115.3 | 2,647.4 | 3,313.3 | 4,146.7 |
| Inventories, % | 30.61 | 24.94 | 35.52 | 28.34 | 16.78 | 27.24 | 27.24 | 27.24 | 27.24 | 27.24 |
| Accounts Payable | 886.1 | 1,655.6 | 1,384.2 | 1,102.5 | 1,158.8 | 2,100.9 | 2,629.4 | 3,290.8 | 4,118.5 | 5,154.4 |
| Accounts Payable, % | 35.42 | 41.18 | 33.03 | 36.28 | 23.37 | 33.86 | 33.86 | 33.86 | 33.86 | 33.86 |
| Capital Expenditure | -4,081.7 | -1,736.1 | -3,778.4 | -1,665.8 | -927.1 | -3,808.4 | -4,766.4 | -5,965.3 | -7,465.7 | -9,343.6 |
| Capital Expenditure, % | -163.14 | -43.18 | -90.16 | -54.82 | -18.7 | -61.37 | -61.37 | -61.37 | -61.37 | -61.37 |
| Tax Rate, % | 0 | 0 | 0 | 0 | 0 | 0 | 0 | 0 | 0 | 0 |
| EBITAT | -907.0 | -932.9 | -1,404.2 | -2,737.9 | -1,921.2 | -2,752.9 | -3,445.4 | -4,312.0 | -5,396.6 | -6,754.1 |
| Depreciation | ||||||||||
| Changes in Account Receivables | ||||||||||
| Changes in Inventories | ||||||||||
| Changes in Accounts Payable | ||||||||||
| Capital Expenditure | ||||||||||
| UFCF | -4,243.9 | -1,933.1 | -3,991.2 | -2,096.7 | -1,266.6 | -4,332.2 | -5,391.2 | -6,747.3 | -8,444.5 | -10,568.5 |
| WACC, % | 4.93 | 4.93 | 4.93 | 4.93 | 4.93 | 4.93 | 4.93 | 4.93 | 4.93 | 4.93 |
| PV UFCF | ||||||||||
| SUM PV UFCF | -30,138.5 | |||||||||
| Long Term Growth Rate, % | 2.00 | |||||||||
| Free cash flow (T + 1) | -10,780 | |||||||||
| Terminal Value | -367,766 | |||||||||
| Present Terminal Value | -289,100 | |||||||||
| Enterprise Value | -319,239 | |||||||||
| Net Debt | 15,109 | |||||||||
| Equity Value | -334,348 | |||||||||
| Diluted Shares Outstanding, MM | 13,989 | |||||||||
| Equity Value Per Share | -23.90 |
What You Will Receive
- Authentic Everdisplay Data: Preloaded financials – covering everything from revenue to EBIT – based on both actual and projected values.
- Comprehensive Customization: Modify all essential parameters (highlighted cells) such as WACC, growth %, and tax rates.
- Immediate Valuation Updates: Automatic recalculations to evaluate the effects of changes on Everdisplay's fair value.
- User-Friendly Excel Template: Designed for quick modifications, scenario analysis, and thorough projections.
- Efficient and Precise: Avoid the hassle of building models from the ground up while ensuring accuracy and adaptability.
Key Features
- 🔍 Real-Life EDO Financials: Pre-filled historical and projected data for Everdisplay Optronics (Shanghai) Co., Ltd. (688538SS).
- ✏️ Fully Customizable Inputs: Modify all essential parameters (yellow cells) such as WACC, growth %, and tax rates.
- 📊 Professional DCF Valuation: Integrated formulas to determine Everdisplay’s intrinsic value through the Discounted Cash Flow method.
- ⚡ Instant Results: Visualize Everdisplay’s valuation immediately after implementing changes.
- Scenario Analysis: Evaluate and compare different financial assumptions side-by-side.
How It Works
- Step 1: Download the Excel file.
- Step 2: Examine Everdisplay Optronics (Shanghai) Co., Ltd.'s (688538SS) pre-filled financial data and projections.
- Step 3: Adjust key inputs such as revenue growth, WACC, and tax rates (marked cells).
- Step 4: Observe the DCF model refresh in real-time as you modify your assumptions.
- Step 5: Evaluate the results and apply the insights for your investment choices.
Why Choose Everdisplay Optronics (688538SS) Calculator?
- Time-Saving: Skip the hassle of building a DCF model from scratch — it’s prepared for you.
- Enhanced Accuracy: Dependable financial data and calculations minimize valuation errors.
- Completely Customizable: Adjust the model to align with your assumptions and forecasts.
- User-Friendly: Intuitive charts and outputs simplify result analysis.
- Endorsed by Professionals: Crafted for experts who prioritize precision and ease of use.
Who Can Benefit from This Product?
- Investors: Evaluate Everdisplay Optronics' valuation before making stock transactions.
- CFOs and Financial Analysts: Optimize valuation methodologies and assess financial projections.
- Startup Founders: Understand the valuation techniques applied to major public entities like Everdisplay Optronics (688538SS).
- Consultants: Provide comprehensive valuation reports for your clientele.
- Students and Educators: Utilize real-world examples to practice and teach valuation methods.
Contents of the Template
- Pre-Filled DCF Model: Everdisplay Optronics’ financial data preloaded for immediate application.
- WACC Calculator: Comprehensive calculations for Weighted Average Cost of Capital.
- Financial Ratios: Assess Everdisplay Optronics’ profitability, leverage, and operational efficiency.
- Editable Inputs: Modify assumptions such as growth rates, profit margins, and capital expenditures to suit your scenarios.
- Financial Statements: Annual and quarterly reports available for in-depth analysis.
- Interactive Dashboard: Effortlessly visualize key valuation metrics and outcomes.
Disclaimer
All information, articles, and product details provided on this website are for general informational and educational purposes only. We do not claim any ownership over, nor do we intend to infringe upon, any trademarks, copyrights, logos, brand names, or other intellectual property mentioned or depicted on this site. Such intellectual property remains the property of its respective owners, and any references here are made solely for identification or informational purposes, without implying any affiliation, endorsement, or partnership.
We make no representations or warranties, express or implied, regarding the accuracy, completeness, or suitability of any content or products presented. Nothing on this website should be construed as legal, tax, investment, financial, medical, or other professional advice. In addition, no part of this site—including articles or product references—constitutes a solicitation, recommendation, endorsement, advertisement, or offer to buy or sell any securities, franchises, or other financial instruments, particularly in jurisdictions where such activity would be unlawful.
All content is of a general nature and may not address the specific circumstances of any individual or entity. It is not a substitute for professional advice or services. Any actions you take based on the information provided here are strictly at your own risk. You accept full responsibility for any decisions or outcomes arising from your use of this website and agree to release us from any liability in connection with your use of, or reliance upon, the content or products found herein.