
|
Farasis Energy Co., Ltd. (688567.SS) Évaluation DCF |
Entièrement Modifiable: Adapté À Vos Besoins Dans Excel Ou Sheets
Conception Professionnelle: Modèles Fiables Et Conformes Aux Normes Du Secteur
Pré-Construits Pour Une Utilisation Rapide Et Efficace
Compatible MAC/PC, entièrement débloqué
Aucune Expertise N'Est Requise; Facile À Suivre
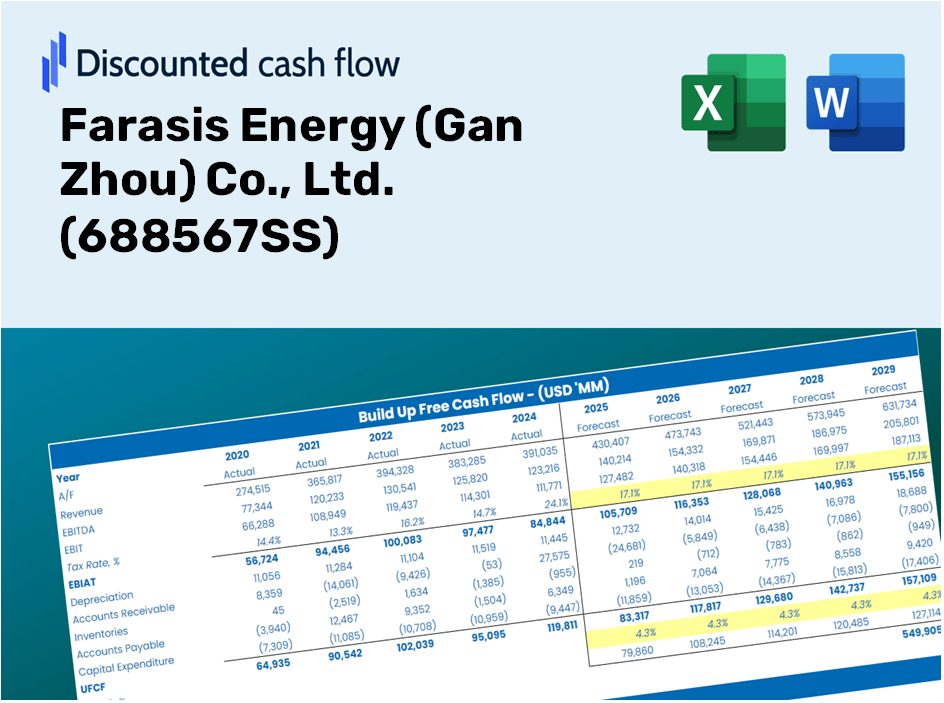
Farasis Energy (Gan Zhou) Co., Ltd. (688567.SS) Bundle
Évaluez Farasis Energy (Gan Zhou) Co., les perspectives financières de Ltd. comme un expert! Ce calculatrice DCF (688567SS) fournit des finances pré-peuplées ainsi que la flexibilité de modification de la croissance des revenus, du WACC, des marges et d'autres hypothèses critiques pour s'aligner sur vos prévisions.
Discounted Cash Flow (DCF) - (USD MM)
| Year | AY1 2020 |
AY2 2021 |
AY3 2022 |
AY4 2023 |
AY5 2024 |
FY1 2025 |
FY2 2026 |
FY3 2027 |
FY4 2028 |
FY5 2029 |
|---|---|---|---|---|---|---|---|---|---|---|
| Revenue | 1,119.7 | 3,500.1 | 11,588.1 | 16,436.4 | 11,680.5 | 17,897.5 | 27,423.6 | 42,020.0 | 64,385.5 | 98,655.3 |
| Revenue Growth, % | 0 | 212.6 | 231.08 | 41.84 | -28.94 | 53.23 | 53.23 | 53.23 | 53.23 | 53.23 |
| EBITDA | -466.2 | -1,105.3 | -492.1 | -761.6 | 563.6 | -2,766.1 | -4,238.4 | -6,494.4 | -9,951.1 | -15,247.6 |
| EBITDA, % | -41.64 | -31.58 | -4.25 | -4.63 | 4.82 | -15.46 | -15.46 | -15.46 | -15.46 | -15.46 |
| Depreciation | 214.1 | 362.7 | 647.1 | 793.4 | 805.3 | 1,675.0 | 2,566.5 | 3,932.5 | 6,025.6 | 9,232.8 |
| Depreciation, % | 19.12 | 10.36 | 5.58 | 4.83 | 6.89 | 9.36 | 9.36 | 9.36 | 9.36 | 9.36 |
| EBIT | -680.4 | -1,468.0 | -1,139.2 | -1,555.1 | -241.7 | -4,441.1 | -6,804.9 | -10,426.9 | -15,976.7 | -24,480.4 |
| EBIT, % | -60.77 | -41.94 | -9.83 | -9.46 | -2.07 | -24.81 | -24.81 | -24.81 | -24.81 | -24.81 |
| Total Cash | 5,836.0 | 5,577.4 | 11,437.5 | 11,464.4 | 6,259.1 | 15,106.8 | 23,147.6 | 35,468.0 | 54,346.2 | 83,272.4 |
| Total Cash, percent | .0 | .0 | .0 | .0 | .0 | .0 | .0 | .0 | .0 | .0 |
| Account Receivables | 1,402.3 | 1,942.7 | 1,962.9 | 3,926.9 | 3,165.1 | 7,997.7 | 12,254.6 | 18,777.2 | 28,771.5 | 44,085.4 |
| Account Receivables, % | 125.25 | 55.5 | 16.94 | 23.89 | 27.1 | 44.69 | 44.69 | 44.69 | 44.69 | 44.69 |
| Inventories | 1,282.7 | 2,854.7 | 7,279.4 | 3,598.6 | 2,717.6 | 10,364.1 | 15,880.5 | 24,333.0 | 37,284.4 | 57,129.3 |
| Inventories, % | 114.56 | 81.56 | 62.82 | 21.89 | 23.27 | 57.91 | 57.91 | 57.91 | 57.91 | 57.91 |
| Accounts Payable | 1,321.8 | 5,286.6 | 11,602.7 | 9,985.4 | 5,702.2 | 14,660.6 | 22,463.8 | 34,420.3 | 52,740.8 | 80,812.6 |
| Accounts Payable, % | 118.06 | 151.04 | 100.13 | 60.75 | 48.82 | 81.91 | 81.91 | 81.91 | 81.91 | 81.91 |
| Capital Expenditure | -2,136.2 | -2,331.3 | -1,867.0 | -1,073.3 | -1,557.6 | -7,251.4 | -11,111.1 | -17,025.0 | -26,086.8 | -39,971.7 |
| Capital Expenditure, % | -190.79 | -66.61 | -16.11 | -6.53 | -13.34 | -40.52 | -40.52 | -40.52 | -40.52 | -40.52 |
| Tax Rate, % | 25.9 | 25.9 | 25.9 | 25.9 | 25.9 | 25.9 | 25.9 | 25.9 | 25.9 | 25.9 |
| EBITAT | -550.4 | -1,251.1 | -919.0 | -1,360.9 | -179.1 | -3,627.5 | -5,558.3 | -8,516.7 | -13,049.8 | -19,995.6 |
| Depreciation | ||||||||||
| Changes in Account Receivables | ||||||||||
| Changes in Inventories | ||||||||||
| Changes in Accounts Payable | ||||||||||
| Capital Expenditure | ||||||||||
| UFCF | -3,835.6 | -1,367.2 | -267.6 | -1,541.3 | -3,571.9 | -12,724.7 | -16,072.9 | -24,627.8 | -37,736.2 | -57,821.6 |
| WACC, % | 13.22 | 13.28 | 13.21 | 13.31 | 13.11 | 13.23 | 13.23 | 13.23 | 13.23 | 13.23 |
| PV UFCF | ||||||||||
| SUM PV UFCF | -94,769.9 | |||||||||
| Long Term Growth Rate, % | 2.00 | |||||||||
| Free cash flow (T + 1) | -58,978 | |||||||||
| Terminal Value | -525,318 | |||||||||
| Present Terminal Value | -282,273 | |||||||||
| Enterprise Value | -377,043 | |||||||||
| Net Debt | -3,493 | |||||||||
| Equity Value | -373,550 | |||||||||
| Diluted Shares Outstanding, MM | 1,236 | |||||||||
| Equity Value Per Share | -302.14 |
Benefits You Will Receive
- Real Farasis Financials (688567SS): Contains historical and projected data for precise valuation.
- Customizable Inputs: Adjust parameters such as WACC, tax rates, revenue growth, and capital expenditures.
- Automated Calculations: Intrinsic value and NPV are calculated in real-time.
- Scenario Analysis: Explore various scenarios to assess Farasis Energy's future performance.
- User-Friendly Design: Designed for professionals while remaining accessible for beginners.
Key Features
- Pre-Loaded Data: Farasis Energy's historical financial statements and pre-filled forecasts.
- Fully Adjustable Inputs: Modify WACC, tax rates, revenue growth, and EBITDA margins as needed.
- Instant Results: View Farasis Energy’s intrinsic value recalculating in real time.
- Clear Visual Outputs: Dashboard charts showcase valuation results and essential metrics.
- Built for Accuracy: A professional tool tailored for analysts, investors, and finance professionals.
How It Works
- Step 1: Download the prebuilt Excel template featuring Farasis Energy (688567SS) data.
- Step 2: Navigate through the pre-filled sheets to familiarize yourself with the essential metrics.
- Step 3: Modify forecasts and assumptions in the editable yellow cells (WACC, growth, margins).
- Step 4: Instantly see the updated results, including the intrinsic value of Farasis Energy (688567SS).
- Step 5: Use the results to make well-informed investment decisions or create detailed reports.
Why Choose This Calculator for Farasis Energy (688567SS)?
- Accurate Data: Utilizes real financial data from Farasis Energy for precise valuation outcomes.
- Customizable: Tailor crucial inputs like growth rates, WACC, and tax rates to fit your forecasts.
- Time-Saving: Built-in calculations allow you to bypass the initial setup process.
- Professional-Grade Tool: Crafted for investors, analysts, and consultants focused on Farasis Energy.
- User-Friendly: Designed with an intuitive interface and clear instructions to assist all users.
Who Can Benefit from This Product?
- Energy Sector Students: Master valuation methodologies while working with actual market data.
- Researchers: Integrate industry-standard models into your academic studies or publications.
- Investors: Validate your investment hypotheses and evaluate the valuation metrics for Farasis Energy (688567SS).
- Financial Analysts: Enhance your productivity with a customizable DCF model tailored for the energy sector.
- Entrepreneurs: Discover how major public firms like Farasis Energy are valued and analyzed.
Contents of the Template
- Operating and Balance Sheet Data: Pre-filled historical data and forecasts for Farasis Energy (Gan Zhou) Co., Ltd. (688567SS), including revenue, EBITDA, EBIT, and capital expenditures.
- WACC Calculation: A dedicated sheet for calculating the Weighted Average Cost of Capital (WACC), featuring key parameters such as Beta, risk-free rate, and share price.
- DCF Valuation (Unlevered and Levered): Customizable Discounted Cash Flow models that present the intrinsic value along with comprehensive calculations.
- Financial Statements: Pre-loaded financial statements (annual and quarterly) to facilitate thorough analysis.
- Key Ratios: A collection of profitability, leverage, and efficiency ratios specific to Farasis Energy (Gan Zhou) Co., Ltd. (688567SS).
- Dashboard and Charts: A visual summary of the valuation outputs and assumptions, designed for easy analysis of results.
Disclaimer
All information, articles, and product details provided on this website are for general informational and educational purposes only. We do not claim any ownership over, nor do we intend to infringe upon, any trademarks, copyrights, logos, brand names, or other intellectual property mentioned or depicted on this site. Such intellectual property remains the property of its respective owners, and any references here are made solely for identification or informational purposes, without implying any affiliation, endorsement, or partnership.
We make no representations or warranties, express or implied, regarding the accuracy, completeness, or suitability of any content or products presented. Nothing on this website should be construed as legal, tax, investment, financial, medical, or other professional advice. In addition, no part of this site—including articles or product references—constitutes a solicitation, recommendation, endorsement, advertisement, or offer to buy or sell any securities, franchises, or other financial instruments, particularly in jurisdictions where such activity would be unlawful.
All content is of a general nature and may not address the specific circumstances of any individual or entity. It is not a substitute for professional advice or services. Any actions you take based on the information provided here are strictly at your own risk. You accept full responsibility for any decisions or outcomes arising from your use of this website and agree to release us from any liability in connection with your use of, or reliance upon, the content or products found herein.