
|
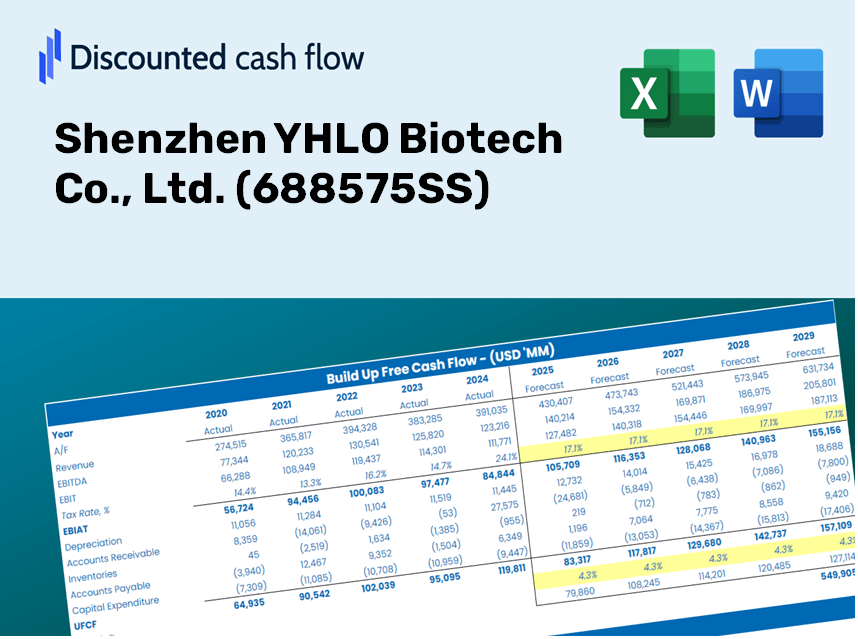
Shenzhen Yhlo Biotech Co., Ltd. (688575.SS) Évaluation DCF |
Entièrement Modifiable: Adapté À Vos Besoins Dans Excel Ou Sheets
Conception Professionnelle: Modèles Fiables Et Conformes Aux Normes Du Secteur
Pré-Construits Pour Une Utilisation Rapide Et Efficace
Compatible MAC/PC, entièrement débloqué
Aucune Expertise N'Est Requise; Facile À Suivre
Shenzhen YHLO Biotech Co., Ltd. (688575.SS) Bundle
Vous cherchez à évaluer la valeur intrinsèque de Shenzhen Yhlo Biotech Co., Ltd.? Notre calculatrice DCF (688575SS) intègre des données réelles avec des fonctionnalités de personnalisation approfondies, vous permettant d'affiner vos prévisions et de faire des choix d'investissement plus éclairés.
Discounted Cash Flow (DCF) - (USD MM)
| Year | AY1 2020 |
AY2 2021 |
AY3 2022 |
AY4 2023 |
AY5 2024 |
FY1 2025 |
FY2 2026 |
FY3 2027 |
FY4 2028 |
FY5 2029 |
|---|---|---|---|---|---|---|---|---|---|---|
| Revenue | 999.0 | 1,177.9 | 3,980.8 | 2,053.1 | 2,011.6 | 2,350.9 | 2,747.4 | 3,210.7 | 3,752.2 | 4,385.1 |
| Revenue Growth, % | 0 | 17.91 | 237.95 | -48.42 | -2.02 | 16.87 | 16.87 | 16.87 | 16.87 | 16.87 |
| EBITDA | 332.7 | 310.2 | 1,290.6 | 440.9 | 574.9 | 668.2 | 780.9 | 912.6 | 1,066.5 | 1,246.4 |
| EBITDA, % | 33.3 | 26.33 | 32.42 | 21.47 | 28.58 | 28.42 | 28.42 | 28.42 | 28.42 | 28.42 |
| Depreciation | 69.5 | 99.3 | 144.7 | 189.3 | 239.5 | 188.8 | 220.6 | 257.8 | 301.3 | 352.1 |
| Depreciation, % | 6.96 | 8.43 | 3.64 | 9.22 | 11.91 | 8.03 | 8.03 | 8.03 | 8.03 | 8.03 |
| EBIT | 263.2 | 210.8 | 1,145.9 | 251.6 | 335.5 | 479.4 | 560.3 | 654.8 | 765.2 | 894.3 |
| EBIT, % | 26.35 | 17.9 | 28.79 | 12.26 | 16.68 | 20.39 | 20.39 | 20.39 | 20.39 | 20.39 |
| Total Cash | 232.4 | 495.0 | 1,364.7 | 567.2 | 534.6 | 723.0 | 844.9 | 987.4 | 1,154.0 | 1,348.6 |
| Total Cash, percent | .0 | .0 | .0 | .0 | .0 | .0 | .0 | .0 | .0 | .0 |
| Account Receivables | 213.6 | 264.8 | 369.9 | 470.3 | 547.9 | 485.7 | 567.6 | 663.4 | 775.2 | 906.0 |
| Account Receivables, % | 21.38 | 22.48 | 9.29 | 22.91 | 27.24 | 20.66 | 20.66 | 20.66 | 20.66 | 20.66 |
| Inventories | 298.2 | 363.8 | 569.5 | 634.5 | 670.8 | 654.9 | 765.4 | 894.4 | 1,045.3 | 1,221.6 |
| Inventories, % | 29.85 | 30.89 | 14.31 | 30.9 | 33.34 | 27.86 | 27.86 | 27.86 | 27.86 | 27.86 |
| Accounts Payable | 81.6 | 162.0 | 337.8 | 223.5 | 295.3 | 263.2 | 307.5 | 359.4 | 420.0 | 490.9 |
| Accounts Payable, % | 8.17 | 13.75 | 8.48 | 10.88 | 14.68 | 11.19 | 11.19 | 11.19 | 11.19 | 11.19 |
| Capital Expenditure | -189.4 | -372.7 | -565.4 | -662.7 | -593.3 | -595.1 | -695.5 | -812.8 | -949.9 | -1,110.1 |
| Capital Expenditure, % | -18.96 | -31.64 | -14.2 | -32.28 | -29.49 | -25.31 | -25.31 | -25.31 | -25.31 | -25.31 |
| Tax Rate, % | 3.26 | 3.26 | 3.26 | 3.26 | 3.26 | 3.26 | 3.26 | 3.26 | 3.26 | 3.26 |
| EBITAT | 229.5 | 189.5 | 977.5 | 267.4 | 324.5 | 440.2 | 514.5 | 601.2 | 702.6 | 821.1 |
| Depreciation | ||||||||||
| Changes in Account Receivables | ||||||||||
| Changes in Inventories | ||||||||||
| Changes in Accounts Payable | ||||||||||
| Capital Expenditure | ||||||||||
| UFCF | -320.6 | -120.3 | 421.9 | -485.8 | -71.3 | 79.8 | -108.4 | -126.7 | -148.0 | -173.0 |
| WACC, % | 6.25 | 6.26 | 6.25 | 6.3 | 6.29 | 6.27 | 6.27 | 6.27 | 6.27 | 6.27 |
| PV UFCF | ||||||||||
| SUM PV UFCF | -370.2 | |||||||||
| Long Term Growth Rate, % | 2.00 | |||||||||
| Free cash flow (T + 1) | -176 | |||||||||
| Terminal Value | -4,133 | |||||||||
| Present Terminal Value | -3,050 | |||||||||
| Enterprise Value | -3,420 | |||||||||
| Net Debt | 415 | |||||||||
| Equity Value | -3,835 | |||||||||
| Diluted Shares Outstanding, MM | 569 | |||||||||
| Equity Value Per Share | -6.74 |
What You Will Receive
- Customizable Excel Template: An entirely adjustable Excel-based DCF Calculator featuring pre-filled financial data for Shenzhen YHLO Biotech Co., Ltd. (688575SS).
- Comprehensive Data: Access to historical performance metrics and forward-looking projections (displayed in the highlighted cells).
- Forecasting Flexibility: Tailor your predictions by adjusting parameters like revenue growth, EBITDA %, and WACC.
- Instant Calculations: Quickly observe how your inputs affect the valuation of Shenzhen YHLO Biotech Co., Ltd. (688575SS).
- Professional Resource: Designed specifically for investors, CFOs, consultants, and financial analysts.
- Intuitive Interface: Organized for straightforward navigation and usability, complete with easy-to-follow instructions.
Key Features
- Real-Time YHLO Data: Comes with Shenzhen YHLO Biotech's historical financials and future projections.
- Fully Customizable Inputs: Modify growth rates, profit margins, discount rates, tax percentages, and capital investments.
- Dynamic Valuation Model: Automatically recalculates Net Present Value (NPV) and intrinsic value based on your adjustments.
- Scenario Analysis: Develop various forecasting scenarios to evaluate different valuation results.
- User-Friendly Interface: Designed to be intuitive and accessible for both experienced professionals and newcomers.
How It Functions
- Step 1: Download the Excel spreadsheet.
- Step 2: Examine the pre-filled data for Shenzhen YHLO Biotech Co., Ltd. (688575SS) (historical and forecasted).
- Step 3: Modify key assumptions (highlighted in yellow) according to your analysis.
- Step 4: Observe the automatic recalculations for the intrinsic value of Shenzhen YHLO Biotech Co., Ltd. (688575SS).
- Step 5: Utilize the results for your investment strategies or reporting purposes.
Why Opt for This Biotech Calculator?
- User-Friendly Interface: Tailored for both newcomers and seasoned professionals.
- Customizable Parameters: Adjust inputs effortlessly to suit your specific analysis needs.
- Real-Time Feedback: Observe immediate changes to Shenzhen YHLO Biotech’s valuation as you make adjustments.
- Pre-Loaded with Data: Comes equipped with Shenzhen YHLO's actual financial figures for swift evaluations.
- Preferred by Experts: Favored by investors and analysts for making well-informed choices.
Who Can Benefit from Our Product?
- Investors: Make informed decisions backed by our advanced valuation tools.
- Financial Analysts: Streamline your workflow with our customizable pre-built DCF models.
- Consultants: Effortlessly tailor our templates for client presentations and reports.
- Finance Enthusiasts: Enhance your knowledge of valuation methodologies with practical examples.
- Educators and Students: Utilize our resources as effective learning aids in finance courses.
Overview of Template Components
- Pre-Filled Data: Contains Shenzhen YHLO Biotech Co., Ltd.'s historical financials and projections.
- Discounted Cash Flow Model: An editable DCF valuation model featuring automatic calculations.
- Weighted Average Cost of Capital (WACC): A specific sheet for WACC calculations utilizing custom inputs.
- Key Financial Ratios: Examine Shenzhen YHLO's profitability, efficiency, and leverage metrics.
- Customizable Inputs: Easily modify revenue growth, margins, and tax rates.
- User-Friendly Dashboard: Visual charts and tables summarizing essential valuation results.
Disclaimer
All information, articles, and product details provided on this website are for general informational and educational purposes only. We do not claim any ownership over, nor do we intend to infringe upon, any trademarks, copyrights, logos, brand names, or other intellectual property mentioned or depicted on this site. Such intellectual property remains the property of its respective owners, and any references here are made solely for identification or informational purposes, without implying any affiliation, endorsement, or partnership.
We make no representations or warranties, express or implied, regarding the accuracy, completeness, or suitability of any content or products presented. Nothing on this website should be construed as legal, tax, investment, financial, medical, or other professional advice. In addition, no part of this site—including articles or product references—constitutes a solicitation, recommendation, endorsement, advertisement, or offer to buy or sell any securities, franchises, or other financial instruments, particularly in jurisdictions where such activity would be unlawful.
All content is of a general nature and may not address the specific circumstances of any individual or entity. It is not a substitute for professional advice or services. Any actions you take based on the information provided here are strictly at your own risk. You accept full responsibility for any decisions or outcomes arising from your use of this website and agree to release us from any liability in connection with your use of, or reliance upon, the content or products found herein.