
|
Hangzhou Alltest Biotech Co., Ltd. (688606.ss) Valation DCF |
Entièrement Modifiable: Adapté À Vos Besoins Dans Excel Ou Sheets
Conception Professionnelle: Modèles Fiables Et Conformes Aux Normes Du Secteur
Pré-Construits Pour Une Utilisation Rapide Et Efficace
Compatible MAC/PC, entièrement débloqué
Aucune Expertise N'Est Requise; Facile À Suivre
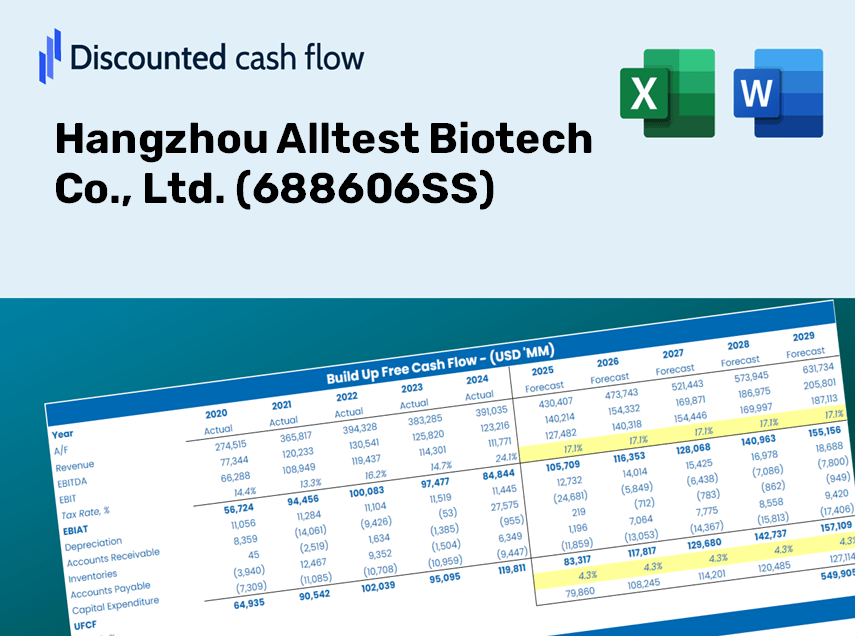
Hangzhou Alltest Biotech Co., Ltd. (688606.SS) Bundle
Simplify Hangzhou Alltest Biotech Co., Ltd. (688606SS) Valation avec cette calculatrice DCF personnalisable! Doté de Real Hangzhou Alltest Biotech Co., Ltd. (688606SS) Financials and Adjustable Prévisions, vous pouvez tester des scénarios et découvrir Hangzhou Alltest Biotech Co., Ltd. (688606SS) juste une valeur juste en minutes.
Discounted Cash Flow (DCF) - (USD MM)
| Year | AY1 2020 |
AY2 2021 |
AY3 2022 |
AY4 2023 |
AY5 2024 |
FY1 2025 |
FY2 2026 |
FY3 2027 |
FY4 2028 |
FY5 2029 |
|---|---|---|---|---|---|---|---|---|---|---|
| Revenue | 1,135.6 | 1,873.4 | 3,388.6 | 754.7 | 866.6 | 1,282.0 | 1,896.7 | 2,805.9 | 4,151.1 | 6,141.3 |
| Revenue Growth, % | 0 | 64.98 | 80.88 | -77.73 | 14.83 | 47.94 | 47.94 | 47.94 | 47.94 | 47.94 |
| EBITDA | 829.9 | 915.2 | 1,441.6 | 249.8 | 380.5 | 619.2 | 916.0 | 1,355.2 | 2,004.8 | 2,966.0 |
| EBITDA, % | 73.09 | 48.85 | 42.54 | 33.09 | 43.9 | 48.3 | 48.3 | 48.3 | 48.3 | 48.3 |
| Depreciation | 5.4 | 17.7 | 58.0 | 49.4 | 32.3 | 34.4 | 50.9 | 75.3 | 111.4 | 164.7 |
| Depreciation, % | 0.47329 | 0.94596 | 1.71 | 6.55 | 3.73 | 2.68 | 2.68 | 2.68 | 2.68 | 2.68 |
| EBIT | 824.6 | 897.5 | 1,383.6 | 200.3 | 348.1 | 584.8 | 865.1 | 1,279.9 | 1,893.5 | 2,801.2 |
| EBIT, % | 72.61 | 47.9 | 40.83 | 26.54 | 40.17 | 45.61 | 45.61 | 45.61 | 45.61 | 45.61 |
| Total Cash | 700.6 | 2,959.5 | 3,814.7 | 2,788.9 | 2,577.7 | 1,183.8 | 1,751.4 | 2,591.0 | 3,833.2 | 5,670.8 |
| Total Cash, percent | .0 | .0 | .0 | .0 | .0 | .0 | .0 | .0 | .0 | .0 |
| Account Receivables | 165.7 | 275.6 | 149.0 | 109.0 | 131.8 | 162.5 | 240.3 | 355.6 | 526.0 | 778.2 |
| Account Receivables, % | 14.59 | 14.71 | 4.4 | 14.45 | 15.21 | 12.67 | 12.67 | 12.67 | 12.67 | 12.67 |
| Inventories | 123.7 | 383.8 | 193.7 | 188.6 | 160.3 | 206.6 | 305.7 | 452.3 | 669.1 | 989.8 |
| Inventories, % | 10.9 | 20.49 | 5.72 | 24.99 | 18.5 | 16.12 | 16.12 | 16.12 | 16.12 | 16.12 |
| Accounts Payable | 62.0 | 360.7 | 171.2 | 77.6 | 104.8 | 133.7 | 197.8 | 292.6 | 432.9 | 640.4 |
| Accounts Payable, % | 5.46 | 19.25 | 5.05 | 10.28 | 12.09 | 10.43 | 10.43 | 10.43 | 10.43 | 10.43 |
| Capital Expenditure | -37.1 | -140.1 | -270.2 | -533.5 | -220.7 | -294.5 | -435.8 | -644.7 | -953.7 | -1,410.9 |
| Capital Expenditure, % | -3.27 | -7.48 | -7.98 | -70.69 | -25.46 | -22.97 | -22.97 | -22.97 | -22.97 | -22.97 |
| Tax Rate, % | 13.01 | 13.01 | 13.01 | 13.01 | 13.01 | 13.01 | 13.01 | 13.01 | 13.01 | 13.01 |
| EBITAT | 707.5 | 767.3 | 1,186.8 | 183.2 | 302.8 | 509.4 | 753.6 | 1,114.8 | 1,649.3 | 2,440.0 |
| Depreciation | ||||||||||
| Changes in Account Receivables | ||||||||||
| Changes in Inventories | ||||||||||
| Changes in Accounts Payable | ||||||||||
| Capital Expenditure | ||||||||||
| UFCF | 448.3 | 573.6 | 1,101.8 | -349.4 | 147.2 | 201.1 | 255.8 | 378.5 | 559.9 | 828.4 |
| WACC, % | 5.61 | 5.61 | 5.61 | 5.62 | 5.61 | 5.61 | 5.61 | 5.61 | 5.61 | 5.61 |
| PV UFCF | ||||||||||
| SUM PV UFCF | 1,821.5 | |||||||||
| Long Term Growth Rate, % | 2.00 | |||||||||
| Free cash flow (T + 1) | 845 | |||||||||
| Terminal Value | 23,381 | |||||||||
| Present Terminal Value | 17,794 | |||||||||
| Enterprise Value | 19,615 | |||||||||
| Net Debt | -919 | |||||||||
| Equity Value | 20,534 | |||||||||
| Diluted Shares Outstanding, MM | 79 | |||||||||
| Equity Value Per Share | 259.33 |
What You Will Receive
- Customizable Excel Template: An entirely adaptable Excel-based DCF Calculator featuring pre-filled financial data for Hangzhou Alltest Biotech Co., Ltd. (688606SS).
- Real-World Data: Access to historical figures and forward-looking projections (highlighted in the yellow cells).
- Flexible Forecasting: Modify forecast parameters such as revenue growth rate, EBITDA %, and WACC.
- Instant Calculations: Quickly see how your inputs affect the valuation of Hangzhou Alltest Biotech Co., Ltd. (688606SS).
- Professional-grade Tool: Designed for investors, CFOs, consultants, and financial analysts.
- User-Friendly Interface: Organized for simplicity and usability, complete with step-by-step guidance.
Key Features
- Comprehensive Financial Data: Gain access to accurate pre-loaded historical financials and future forecasts for Hangzhou Alltest Biotech Co., Ltd. (688606SS).
- Customizable Assumptions: Modify highlighted parameters such as WACC, growth rates, and profit margins directly in the provided editable fields.
- Real-Time Calculations: Enjoy automatic updates to DCF, Net Present Value (NPV), and cash flow analyses with every change.
- User-Friendly Dashboard: Utilize easily interpretable charts and summaries to visualize your valuation insights.
- Designed for All Skill Levels: A straightforward, intuitive layout crafted for investors, CFOs, and consultants alike.
How It Works
- Step 1: Download the prebuilt Excel template featuring Hangzhou Alltest Biotech Co., Ltd.'s (688606SS) data.
- Step 2: Review the filled-out sheets to familiarize yourself with key performance indicators.
- Step 3: Modify forecasts and assumptions in the highlighted yellow cells (WACC, growth, margins).
- Step 4: See updated results immediately, including the intrinsic value of Hangzhou Alltest Biotech Co., Ltd. (688606SS).
- Step 5: Use the generated outputs to make informed investment choices or create detailed reports.
Why Choose Hangzhou Alltest Biotech Co., Ltd. (688606SS)?
- Precision: Leverage real-time biotech data for unparalleled accuracy.
- Adaptability: Tailored to empower users to explore and adjust inputs effortlessly.
- Efficiency: Eliminate the complexities of developing a detailed financial model from the ground up.
- Expert-Level: Crafted with the insight and usability expected from top-tier biotech professionals.
- Intuitive Design: Simple to navigate, making it accessible for users with varying levels of financial expertise.
Who Can Benefit from This Product?
- Investors: Accurately assess the fair value of Hangzhou Alltest Biotech Co., Ltd. (688606SS) before making investment choices.
- CFOs: Utilize a high-quality DCF model for detailed financial reporting and analysis.
- Consultants: Efficiently modify the template for valuation reports tailored to client needs.
- Entrepreneurs: Discover financial modeling techniques used by leading companies in the biotech industry.
- Educators: Employ it as a resource to illustrate various valuation methodologies in the classroom.
What the Template Includes
- Pre-Filled DCF Model: Hangzhou Alltest Biotech Co., Ltd.’s (688606SS) financial data preloaded for immediate application.
- WACC Calculator: Comprehensive calculations for Weighted Average Cost of Capital.
- Financial Ratios: Assess Hangzhou Alltest Biotech Co., Ltd.’s (688606SS) profitability, leverage, and operational efficiency.
- Editable Inputs: Modify assumptions such as growth rates, profit margins, and capital expenditures to fit your analysis.
- Financial Statements: Access annual and quarterly reports for in-depth evaluation.
- Interactive Dashboard: Effortlessly visualize key valuation metrics and outcomes.
Disclaimer
All information, articles, and product details provided on this website are for general informational and educational purposes only. We do not claim any ownership over, nor do we intend to infringe upon, any trademarks, copyrights, logos, brand names, or other intellectual property mentioned or depicted on this site. Such intellectual property remains the property of its respective owners, and any references here are made solely for identification or informational purposes, without implying any affiliation, endorsement, or partnership.
We make no representations or warranties, express or implied, regarding the accuracy, completeness, or suitability of any content or products presented. Nothing on this website should be construed as legal, tax, investment, financial, medical, or other professional advice. In addition, no part of this site—including articles or product references—constitutes a solicitation, recommendation, endorsement, advertisement, or offer to buy or sell any securities, franchises, or other financial instruments, particularly in jurisdictions where such activity would be unlawful.
All content is of a general nature and may not address the specific circumstances of any individual or entity. It is not a substitute for professional advice or services. Any actions you take based on the information provided here are strictly at your own risk. You accept full responsibility for any decisions or outcomes arising from your use of this website and agree to release us from any liability in connection with your use of, or reliance upon, the content or products found herein.