
|
Stanley Electric Co., Ltd. (6923.T) Évaluation DCF |
Entièrement Modifiable: Adapté À Vos Besoins Dans Excel Ou Sheets
Conception Professionnelle: Modèles Fiables Et Conformes Aux Normes Du Secteur
Pré-Construits Pour Une Utilisation Rapide Et Efficace
Compatible MAC/PC, entièrement débloqué
Aucune Expertise N'Est Requise; Facile À Suivre
Stanley Electric Co., Ltd. (6923.T) Bundle
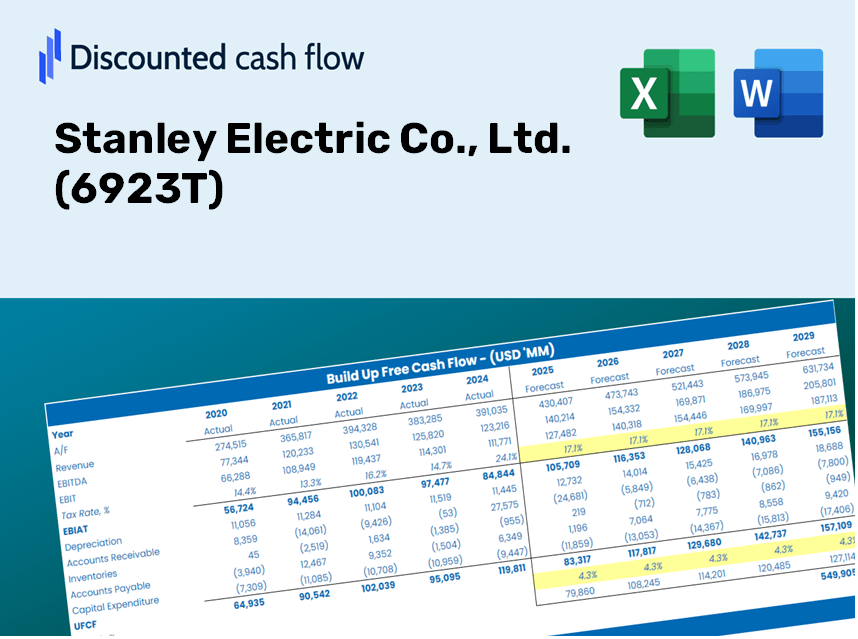
Évaluez les perspectives financières de Stanley Electric Co., Ltd. Comme un expert! Ce (6923T) Calculator DCF vous fournit des finances préchargées tout en vous permettant la flexibilité complète de modifier la croissance des revenus, le WACC, les marges et d'autres hypothèses essentielles pour s'aligner sur vos prévisions.
Discounted Cash Flow (DCF) - (USD MM)
| Year | AY1 2021 |
AY2 2022 |
AY3 2023 |
AY4 2024 |
AY5 2025 |
FY1 2026 |
FY2 2027 |
FY3 2028 |
FY4 2029 |
FY5 2030 |
|---|---|---|---|---|---|---|---|---|---|---|
| Revenue | 359,710.0 | 382,561.0 | 437,790.0 | 472,397.0 | 509,565.0 | 556,142.0 | 606,976.4 | 662,457.3 | 723,009.5 | 789,096.4 |
| Revenue Growth, % | 0 | 6.35 | 14.44 | 7.9 | 7.87 | 9.14 | 9.14 | 9.14 | 9.14 | 9.14 |
| EBITDA | 71,185.0 | 72,181.0 | 86,683.0 | 72,879.0 | 97,132.0 | 103,383.2 | 112,833.0 | 123,146.5 | 134,402.8 | 146,687.9 |
| EBITDA, % | 19.79 | 18.87 | 19.8 | 15.43 | 19.06 | 18.59 | 18.59 | 18.59 | 18.59 | 18.59 |
| Depreciation | 33,425.0 | 36,317.0 | 41,613.0 | 37,044.0 | 43,683.0 | 49,724.5 | 54,269.6 | 59,230.2 | 64,644.1 | 70,552.9 |
| Depreciation, % | 9.29 | 9.49 | 9.51 | 7.84 | 8.57 | 8.94 | 8.94 | 8.94 | 8.94 | 8.94 |
| EBIT | 37,760.0 | 35,864.0 | 45,070.0 | 35,835.0 | 53,449.0 | 53,658.7 | 58,563.4 | 63,916.4 | 69,758.7 | 76,135.0 |
| EBIT, % | 10.5 | 9.37 | 10.29 | 7.59 | 10.49 | 9.65 | 9.65 | 9.65 | 9.65 | 9.65 |
| Total Cash | 138,584.0 | 150,754.0 | 173,408.0 | 198,640.0 | 219,614.0 | 225,449.6 | 246,056.9 | 268,547.8 | 293,094.6 | 319,885.0 |
| Total Cash, percent | .0 | .0 | .0 | .0 | .0 | .0 | .0 | .0 | .0 | .0 |
| Account Receivables | 65,146.0 | 67,993.0 | 69,810.0 | 75,043.0 | 77,368.0 | 92,206.7 | 100,634.9 | 109,833.5 | 119,872.9 | 130,829.9 |
| Account Receivables, % | 18.11 | 17.77 | 15.95 | 15.89 | 15.18 | 16.58 | 16.58 | 16.58 | 16.58 | 16.58 |
| Inventories | 34,214.0 | 49,308.0 | 46,226.0 | 55,521.0 | 55,498.0 | 61,847.1 | 67,500.3 | 73,670.2 | 80,404.0 | 87,753.4 |
| Inventories, % | 9.51 | 12.89 | 10.56 | 11.75 | 10.89 | 11.12 | 11.12 | 11.12 | 11.12 | 11.12 |
| Accounts Payable | 37,419.0 | 39,246.0 | 37,902.0 | 40,575.0 | 40,995.0 | 51,113.0 | 55,785.0 | 60,884.0 | 66,449.1 | 72,522.9 |
| Accounts Payable, % | 10.4 | 10.26 | 8.66 | 8.59 | 8.05 | 9.19 | 9.19 | 9.19 | 9.19 | 9.19 |
| Capital Expenditure | -31,192.0 | -28,904.0 | -36,265.0 | -27,098.0 | -45,622.0 | -43,601.4 | -47,586.8 | -51,936.5 | -56,683.8 | -61,865.0 |
| Capital Expenditure, % | -8.67 | -7.56 | -8.28 | -5.74 | -8.95 | -7.84 | -7.84 | -7.84 | -7.84 | -7.84 |
| Tax Rate, % | 39.55 | 39.55 | 39.55 | 39.55 | 39.55 | 39.55 | 39.55 | 39.55 | 39.55 | 39.55 |
| EBITAT | 22,977.0 | 21,499.0 | 26,602.8 | 22,072.6 | 32,311.3 | 32,395.8 | 35,357.0 | 38,588.8 | 42,116.0 | 45,965.6 |
| Depreciation | ||||||||||
| Changes in Account Receivables | ||||||||||
| Changes in Inventories | ||||||||||
| Changes in Accounts Payable | ||||||||||
| Capital Expenditure | ||||||||||
| UFCF | -36,731.0 | 12,798.0 | 31,871.8 | 20,163.6 | 28,490.3 | 27,449.1 | 32,630.4 | 35,613.0 | 38,868.2 | 42,421.0 |
| WACC, % | 7.37 | 7.37 | 7.37 | 7.38 | 7.37 | 7.37 | 7.37 | 7.37 | 7.37 | 7.37 |
| PV UFCF | ||||||||||
| SUM PV UFCF | 141,602.8 | |||||||||
| Long Term Growth Rate, % | 2.00 | |||||||||
| Free cash flow (T + 1) | 43,269 | |||||||||
| Terminal Value | 805,321 | |||||||||
| Present Terminal Value | 564,280 | |||||||||
| Enterprise Value | 705,883 | |||||||||
| Net Debt | -174,939 | |||||||||
| Equity Value | 880,822 | |||||||||
| Diluted Shares Outstanding, MM | 156 | |||||||||
| Equity Value Per Share | 5,652.53 |
What You Will Receive
- Customizable Excel Template: A fully adaptable Excel-based DCF Calculator featuring pre-filled financial data for Stanley Electric Co., Ltd. (6923T).
- Comprehensive Data: Access to historical figures and forward-looking projections (highlighted in the yellow cells).
- Versatile Forecasting: Easily modify assumptions such as revenue growth, EBITDA margin, and WACC.
- Instant Calculations: Quickly observe how your inputs influence the valuation of Stanley Electric Co., Ltd. (6923T).
- Professional Resource: Designed for use by investors, CFOs, consultants, and financial analysts.
- Intuitive Interface: Organized for easy navigation and clarity, with detailed step-by-step guidance.
Key Features
- Comprehensive Historical Data: Stanley Electric Co., Ltd.'s historical financial statements and pre-filled projections.
- Customizable Inputs: Modify WACC, tax rates, revenue growth, and EBITDA margins as needed.
- Real-Time Results: Instantly view the intrinsic value of Stanley Electric Co., Ltd. recalculating live.
- Intuitive Visual Displays: Dashboard charts present valuation results and essential metrics clearly.
- Designed for Precision: A professional-grade tool tailored for analysts, investors, and finance professionals.
How It Works
- Step 1: Download the Excel file.
- Step 2: Examine the pre-filled Stanley Electric data (historical and projected).
- Step 3: Modify key assumptions (yellow cells) according to your analysis.
- Step 4: Observe the automatic recalculations for Stanley Electric’s intrinsic value.
- Step 5: Utilize the results for investment decisions or reporting.
Why Choose This Calculator for Stanley Electric Co., Ltd. (6923T)?
- All-in-One Tool: Features DCF, WACC, and financial ratio analyses all in a single solution.
- Flexible Input Options: Modify the yellow-highlighted cells to explore different financial scenarios.
- In-Depth Analysis: Automatically computes the intrinsic value and Net Present Value for Stanley Electric Co., Ltd. (6923T).
- Prepopulated Data: Comes with historical and projected data for a reliable foundation.
- High-Quality Insights: Perfect for financial analysts, investors, and business consultants focused on Stanley Electric Co., Ltd. (6923T).
Who Can Benefit from This Product?
- Investors: Evaluate Stanley Electric Co., Ltd.’s (6923T) valuation prior to making stock transactions.
- CFOs and Financial Analysts: Enhance valuation methodologies and assess financial projections.
- Startup Founders: Understand the valuation strategies employed by established companies like Stanley Electric Co., Ltd. (6923T).
- Consultants: Provide detailed valuation reports to serve client needs.
- Students and Educators: Utilize real-world examples to learn and teach valuation concepts.
Contents of the Template
- Preloaded 6923T Data: Historical and projected financial figures, including revenue, EBIT, and capital expenditures.
- DCF and WACC Models: Professional-grade sheets for calculating intrinsic value and Weighted Average Cost of Capital.
- Editable Inputs: Yellow-highlighted cells for modifying growth rates, tax rates, and discount rates.
- Financial Statements: Detailed annual and quarterly financials for in-depth analysis.
- Key Ratios: Profitability, leverage, and efficiency ratios to assess performance.
- Dashboard and Charts: Visual summaries of valuation results and assumptions.
Disclaimer
All information, articles, and product details provided on this website are for general informational and educational purposes only. We do not claim any ownership over, nor do we intend to infringe upon, any trademarks, copyrights, logos, brand names, or other intellectual property mentioned or depicted on this site. Such intellectual property remains the property of its respective owners, and any references here are made solely for identification or informational purposes, without implying any affiliation, endorsement, or partnership.
We make no representations or warranties, express or implied, regarding the accuracy, completeness, or suitability of any content or products presented. Nothing on this website should be construed as legal, tax, investment, financial, medical, or other professional advice. In addition, no part of this site—including articles or product references—constitutes a solicitation, recommendation, endorsement, advertisement, or offer to buy or sell any securities, franchises, or other financial instruments, particularly in jurisdictions where such activity would be unlawful.
All content is of a general nature and may not address the specific circumstances of any individual or entity. It is not a substitute for professional advice or services. Any actions you take based on the information provided here are strictly at your own risk. You accept full responsibility for any decisions or outcomes arising from your use of this website and agree to release us from any liability in connection with your use of, or reliance upon, the content or products found herein.