
|
FANUC Corporation (6954.T) Évaluation DCF |
Entièrement Modifiable: Adapté À Vos Besoins Dans Excel Ou Sheets
Conception Professionnelle: Modèles Fiables Et Conformes Aux Normes Du Secteur
Pré-Construits Pour Une Utilisation Rapide Et Efficace
Compatible MAC/PC, entièrement débloqué
Aucune Expertise N'Est Requise; Facile À Suivre
Fanuc Corporation (6954.T) Bundle
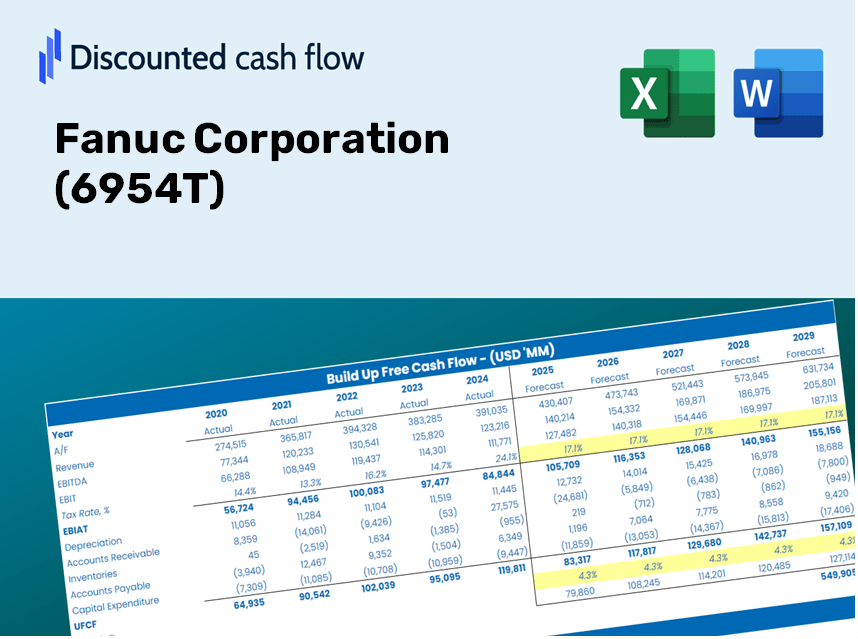
Simplifier la valorisation FanUc Corporation (6954T) avec cette calculatrice DCF personnalisable! Doté de Real Fanuc Corporation (6954T) et des intrants de prévision ajustés, vous pouvez tester les scénarios et découvrir la juste valeur de FanUc Corporation (6954T) en minutes.
Discounted Cash Flow (DCF) - (USD MM)
| Year | AY1 2021 |
AY2 2022 |
AY3 2023 |
AY4 2024 |
AY5 2025 |
FY1 2026 |
FY2 2027 |
FY3 2028 |
FY4 2029 |
FY5 2030 |
|---|---|---|---|---|---|---|---|---|---|---|
| Revenue | 551,287.0 | 733,008.0 | 851,956.0 | 795,274.0 | 797,129.0 | 882,363.1 | 976,710.9 | 1,081,147.0 | 1,196,750.0 | 1,324,714.1 |
| Revenue Growth, % | 0 | 32.96 | 16.23 | -6.65 | 0.23325 | 10.69 | 10.69 | 10.69 | 10.69 | 10.69 |
| EBITDA | 157,616.0 | 230,317.0 | 240,548.0 | 190,920.0 | 243,186.0 | 251,933.5 | 278,871.9 | 308,690.6 | 341,697.7 | 378,234.2 |
| EBITDA, % | 28.59 | 31.42 | 28.23 | 24.01 | 30.51 | 28.55 | 28.55 | 28.55 | 28.55 | 28.55 |
| Depreciation | 45,102.0 | 47,077.0 | 49,189.0 | 49,001.0 | 46,448.0 | 57,116.7 | 63,224.0 | 69,984.3 | 77,467.4 | 85,750.7 |
| Depreciation, % | 8.18 | 6.42 | 5.77 | 6.16 | 5.83 | 6.47 | 6.47 | 6.47 | 6.47 | 6.47 |
| EBIT | 112,514.0 | 183,240.0 | 191,359.0 | 141,919.0 | 196,738.0 | 194,816.9 | 215,647.9 | 238,706.3 | 264,230.3 | 292,483.5 |
| EBIT, % | 20.41 | 25 | 22.46 | 17.85 | 24.68 | 22.08 | 22.08 | 22.08 | 22.08 | 22.08 |
| Total Cash | 586,784.0 | 601,215.0 | 529,228.0 | 539,079.0 | 606,504.0 | 684,732.8 | 757,948.7 | 838,993.4 | 928,703.8 | 1,028,006.7 |
| Total Cash, percent | .0 | .0 | .0 | .0 | .0 | .0 | .0 | .0 | .0 | .0 |
| Account Receivables | 127,389.0 | 149,171.0 | 161,386.0 | 154,434.0 | 154,448.0 | 178,582.5 | 197,677.7 | 218,814.6 | 242,211.7 | 268,110.4 |
| Account Receivables, % | 23.11 | 20.35 | 18.94 | 19.42 | 19.38 | 20.24 | 20.24 | 20.24 | 20.24 | 20.24 |
| Inventories | 164,268.0 | 249,564.0 | 350,577.0 | 362,546.0 | 306,439.0 | 333,575.2 | 369,243.2 | 408,725.0 | 452,428.5 | 500,805.0 |
| Inventories, % | 29.8 | 34.05 | 41.15 | 45.59 | 38.44 | 37.8 | 37.8 | 37.8 | 37.8 | 37.8 |
| Accounts Payable | 44,015.0 | 49,473.0 | 56,935.0 | 42,938.0 | 37,454.0 | 55,613.5 | 61,560.1 | 68,142.5 | 75,428.7 | 83,494.0 |
| Accounts Payable, % | 7.98 | 6.75 | 6.68 | 5.4 | 4.7 | 6.3 | 6.3 | 6.3 | 6.3 | 6.3 |
| Capital Expenditure | -21,768.0 | -34,363.0 | -47,066.0 | -53,884.0 | -40,805.0 | -45,980.8 | -50,897.4 | -56,339.7 | -62,363.9 | -69,032.2 |
| Capital Expenditure, % | -3.95 | -4.69 | -5.52 | -6.78 | -5.12 | -5.21 | -5.21 | -5.21 | -5.21 | -5.21 |
| Tax Rate, % | 25 | 25 | 25 | 25 | 25 | 25 | 25 | 25 | 25 | 25 |
| EBITAT | 82,160.5 | 133,630.6 | 141,864.1 | 103,974.0 | 147,557.0 | 143,521.1 | 158,867.3 | 175,854.3 | 194,657.8 | 215,471.8 |
| Depreciation | ||||||||||
| Changes in Account Receivables | ||||||||||
| Changes in Inventories | ||||||||||
| Changes in Accounts Payable | ||||||||||
| Capital Expenditure | ||||||||||
| UFCF | -142,147.5 | 44,724.6 | 38,221.1 | 80,077.0 | 203,809.0 | 121,545.7 | 122,377.2 | 135,462.6 | 149,947.1 | 165,980.4 |
| WACC, % | 5.96 | 5.96 | 5.96 | 5.96 | 5.96 | 5.96 | 5.96 | 5.96 | 5.96 | 5.96 |
| PV UFCF | ||||||||||
| SUM PV UFCF | 580,739.5 | |||||||||
| Long Term Growth Rate, % | 2.00 | |||||||||
| Free cash flow (T + 1) | 169,300 | |||||||||
| Terminal Value | 4,272,086 | |||||||||
| Present Terminal Value | 3,197,938 | |||||||||
| Enterprise Value | 3,778,678 | |||||||||
| Net Debt | -494,800 | |||||||||
| Equity Value | 4,273,478 | |||||||||
| Diluted Shares Outstanding, MM | 938 | |||||||||
| Equity Value Per Share | 4,555.83 |
What You Will Receive
- Customizable Excel Template: A fully adjustable Excel-based DCF Calculator featuring pre-loaded financial data for Fanuc Corporation (6954T).
- Authentic Data: Access to historical performance and future projections (highlighted in the yellow cells).
- Flexible Forecasting: Adjust key assumptions including revenue growth, EBITDA margin, and WACC.
- Instant Calculations: See how your inputs directly influence the valuation of Fanuc Corporation (6954T).
- Professional Resource: Designed for investors, CFOs, consultants, and financial analysts.
- User-Friendly Format: Organized for simplicity and ease of navigation, complete with step-by-step guidance.
Key Features
- Authentic Fanuc Financials: Gain access to reliable pre-loaded historical data and future forecasts.
- Adjustable Forecast Parameters: Modify yellow-highlighted cells such as WACC, growth rates, and profit margins.
- Real-Time Calculations: Automatic updates for DCF, Net Present Value (NPV), and cash flow assessments.
- Interactive Visual Dashboard: User-friendly charts and summaries to help you visualize your valuation outcomes.
- Suitable for All Skill Levels: An intuitive design tailored for investors, CFOs, and consultants alike.
How It Works
- Step 1: Download the Excel file.
- Step 2: Examine the pre-filled Fanuc Corporation (6954T) data (both historical and forecasted).
- Step 3: Modify key assumptions (highlighted in yellow) according to your findings.
- Step 4: Observe the automatic updates for Fanuc Corporation’s intrinsic value.
- Step 5: Leverage the results for investment strategies or reporting purposes.
Why Select This Calculator for Fanuc Corporation (6954T)?
- User-Friendly Design: Suitable for both novices and seasoned professionals.
- Customizable Inputs: Easily adjust parameters to suit your specific analysis.
- Real-Time Updates: Instantly visualize changes in Fanuc’s valuation as you modify inputs.
- Preloaded Financial Data: Comes equipped with Fanuc’s actual financial information for swift evaluations.
- Relied Upon by Experts: A tool of choice for investors and analysts making strategic decisions.
Who Should Use This Product?
- Investors: Accurately assess Fanuc Corporation's (6954T) intrinsic value before making investment choices.
- CFOs: Utilize a professional-grade DCF model for comprehensive financial reporting and analysis.
- Consultants: Efficiently customize the template to create valuation reports for clients concerning Fanuc Corporation (6954T).
- Entrepreneurs: Acquire valuable insights into the financial modeling practices of leading companies, including Fanuc Corporation (6954T).
- Educators: Employ this resource as a teaching instrument to illustrate various valuation methodologies.
What the Template Contains
- Historical Data: Contains Fanuc Corporation's past financial information and foundational forecasts.
- DCF and Levered DCF Models: Comprehensive templates for calculating the intrinsic value of Fanuc Corporation (6954T).
- WACC Sheet: Built-in calculations for the Weighted Average Cost of Capital.
- Editable Inputs: Customize key variables such as growth rates, EBITDA percentages, and CAPEX assumptions.
- Quarterly and Annual Statements: A thorough breakdown of Fanuc Corporation's financials.
- Interactive Dashboard: A dynamic tool to visualize valuation outcomes and forecasts.
Disclaimer
All information, articles, and product details provided on this website are for general informational and educational purposes only. We do not claim any ownership over, nor do we intend to infringe upon, any trademarks, copyrights, logos, brand names, or other intellectual property mentioned or depicted on this site. Such intellectual property remains the property of its respective owners, and any references here are made solely for identification or informational purposes, without implying any affiliation, endorsement, or partnership.
We make no representations or warranties, express or implied, regarding the accuracy, completeness, or suitability of any content or products presented. Nothing on this website should be construed as legal, tax, investment, financial, medical, or other professional advice. In addition, no part of this site—including articles or product references—constitutes a solicitation, recommendation, endorsement, advertisement, or offer to buy or sell any securities, franchises, or other financial instruments, particularly in jurisdictions where such activity would be unlawful.
All content is of a general nature and may not address the specific circumstances of any individual or entity. It is not a substitute for professional advice or services. Any actions you take based on the information provided here are strictly at your own risk. You accept full responsibility for any decisions or outcomes arising from your use of this website and agree to release us from any liability in connection with your use of, or reliance upon, the content or products found herein.