
|
SBI Sumishin Net Bank, Ltd. (7163.T) Évaluation DCF |
Entièrement Modifiable: Adapté À Vos Besoins Dans Excel Ou Sheets
Conception Professionnelle: Modèles Fiables Et Conformes Aux Normes Du Secteur
Pré-Construits Pour Une Utilisation Rapide Et Efficace
Compatible MAC/PC, entièrement débloqué
Aucune Expertise N'Est Requise; Facile À Suivre
SBI Sumishin Net Bank, Ltd. (7163.T) Bundle
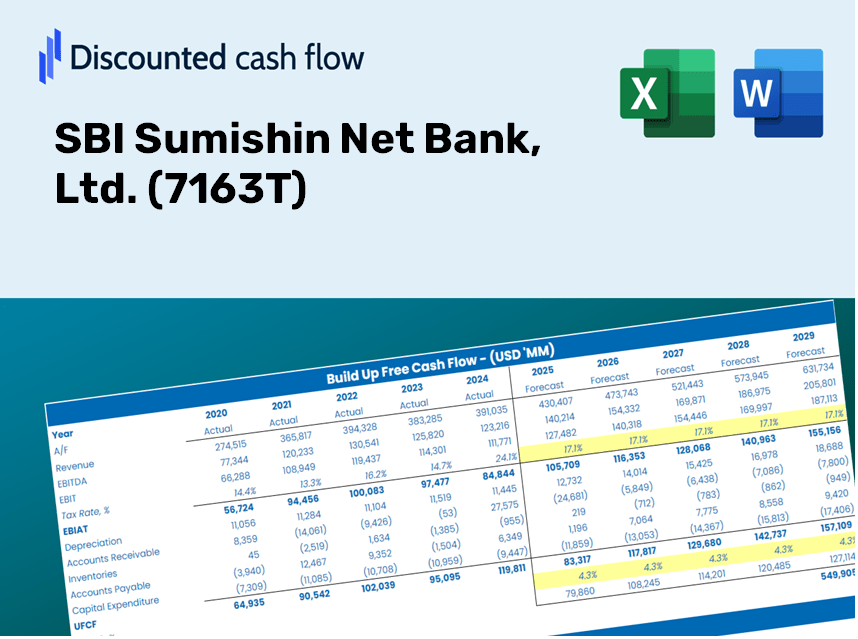
Rationalisez votre analyse et améliorez la précision avec notre (7163T) Calculatrice DCF! Équipée de données réelles de SBI Sumishin Net Bank, Ltd. et des hypothèses personnalisables, cet outil vous permet de prévoir, d'évaluer et de valoriser (7163T) comme un investisseur chevronné.
Discounted Cash Flow (DCF) - (USD MM)
| Year | AY1 2021 |
AY2 2022 |
AY3 2023 |
AY4 2024 |
AY5 2025 |
FY1 2026 |
FY2 2027 |
FY3 2028 |
FY4 2029 |
FY5 2030 |
|---|---|---|---|---|---|---|---|---|---|---|
| Revenue | 56,370.0 | 60,872.0 | 90,185.0 | 84,537.0 | 124,962.0 | 155,483.4 | 193,459.6 | 240,711.3 | 299,504.0 | 372,656.5 |
| Revenue Growth, % | 0 | 7.99 | 48.16 | -6.26 | 47.82 | 24.42 | 24.42 | 24.42 | 24.42 | 24.42 |
| EBITDA | 20,742.0 | 28,171.0 | 35,751.0 | 43,309.0 | 50,202.0 | 66,584.8 | 82,847.8 | 103,083.0 | 128,260.6 | 159,587.7 |
| EBITDA, % | 36.8 | 46.28 | 39.64 | 51.23 | 40.17 | 42.82 | 42.82 | 42.82 | 42.82 | 42.82 |
| Depreciation | .0 | 5,309.0 | 6,721.0 | 7,703.0 | 8,428.0 | 9,960.4 | 12,393.2 | 15,420.2 | 19,186.5 | 23,872.7 |
| Depreciation, % | 0 | 8.72 | 7.45 | 9.11 | 6.74 | 6.41 | 6.41 | 6.41 | 6.41 | 6.41 |
| EBIT | 20,742.0 | 22,862.0 | 29,030.0 | 35,606.0 | 41,774.0 | 56,624.3 | 70,454.6 | 87,662.8 | 109,074.1 | 135,715.0 |
| EBIT, % | 36.8 | 37.56 | 32.19 | 42.12 | 33.43 | 36.42 | 36.42 | 36.42 | 36.42 | 36.42 |
| Total Cash | 1,511,526.0 | 1,767,429.0 | 1,100,449.0 | 1,665,582.0 | 1,494,507.0 | 155,483.4 | 193,459.6 | 240,711.3 | 299,504.0 | 372,656.5 |
| Total Cash, percent | .0 | .0 | .0 | .0 | .0 | .0 | .0 | .0 | .0 | .0 |
| Account Receivables | .0 | .0 | .0 | .0 | .0 | .0 | .0 | .0 | .0 | .0 |
| Account Receivables, % | 0 | 0 | 0 | 0 | 0 | 0 | 0 | 0 | 0 | 0 |
| Inventories | .0 | .0 | .0 | .0 | .0 | .0 | .0 | .0 | .0 | .0 |
| Inventories, % | 0 | 0 | 0 | 0 | 0 | 0 | 0 | 0 | 0 | 0 |
| Accounts Payable | .0 | .0 | .0 | .0 | .0 | .0 | .0 | .0 | .0 | .0 |
| Accounts Payable, % | 0 | 0 | 0 | 0 | 0 | 0 | 0 | 0 | 0 | 0 |
| Capital Expenditure | -8,140.0 | -10,899.0 | -10,464.0 | -179.0 | -1,557.0 | -14,119.6 | -17,568.3 | -21,859.3 | -27,198.3 | -33,841.4 |
| Capital Expenditure, % | -14.44 | -17.9 | -11.6 | -0.21174 | -1.25 | -9.08 | -9.08 | -9.08 | -9.08 | -9.08 |
| Tax Rate, % | 32.67 | 32.67 | 32.67 | 32.67 | 32.67 | 32.67 | 32.67 | 32.67 | 32.67 | 32.67 |
| EBITAT | 14,400.8 | 17,101.8 | 19,932.0 | 24,846.4 | 28,127.0 | 39,637.7 | 49,319.0 | 61,364.9 | 76,353.1 | 95,002.0 |
| Depreciation | ||||||||||
| Changes in Account Receivables | ||||||||||
| Changes in Inventories | ||||||||||
| Changes in Accounts Payable | ||||||||||
| Capital Expenditure | ||||||||||
| UFCF | 6,260.8 | 11,511.8 | 16,189.0 | 32,370.4 | 34,998.0 | 35,478.4 | 44,143.9 | 54,925.8 | 68,341.2 | 85,033.3 |
| WACC, % | 4.09 | 4.21 | 4.07 | 4.1 | 4.04 | 4.1 | 4.1 | 4.1 | 4.1 | 4.1 |
| PV UFCF | ||||||||||
| SUM PV UFCF | 251,237.4 | |||||||||
| Long Term Growth Rate, % | 2.00 | |||||||||
| Free cash flow (T + 1) | 86,734 | |||||||||
| Terminal Value | 4,125,935 | |||||||||
| Present Terminal Value | 3,374,610 | |||||||||
| Enterprise Value | 3,625,847 | |||||||||
| Net Debt | -341,140 | |||||||||
| Equity Value | 3,966,987 | |||||||||
| Diluted Shares Outstanding, MM | 151 | |||||||||
| Equity Value Per Share | 26,309.94 |
Benefits You Will Receive
- Comprehensive Financial Model: Leverage SBI Sumishin Net Bank’s actual data for accurate DCF valuation.
- Complete Forecasting Control: Modify revenue growth, profit margins, WACC, and other essential parameters.
- Real-Time Calculations: Enjoy immediate updates that reflect your changes instantly.
- Professional-Grade Template: A polished Excel file crafted for high-quality valuation purposes.
- Flexible and Reusable: Designed for adaptability, allowing for ongoing use in detailed financial projections.
Key Features
- Comprehensive Data: Access SBI Sumishin Net Bank's historical financial reports and detailed forecasts.
- Customizable Parameters: Adjust WACC, tax rates, revenue growth, and EBITDA margins according to your analysis.
- Real-Time Insights: Monitor the recalculation of SBI Sumishin Net Bank’s intrinsic value instantly.
- Intuitive Visuals: Interactive dashboard charts present valuation outcomes and essential metrics clearly.
- Engineered for Precision: A robust tool tailored for analysts, investors, and finance professionals.
How It Works
- Download the Template: Obtain immediate access to the Excel-based SBI Sumishin Net Bank, Ltd. (7163T) DCF Calculator.
- Input Your Assumptions: Modify the yellow-highlighted cells for growth rates, WACC, margins, and other key metrics.
- Instant Calculations: The model will automatically refresh to reflect SBI Sumishin Net Bank, Ltd.'s (7163T) intrinsic value.
- Test Scenarios: Explore various assumptions to assess possible changes in valuation.
- Analyze and Decide: Utilize the outcomes to inform your investment strategy or financial evaluation.
Why Choose This Calculator for SBI Sumishin Net Bank, Ltd. (7163T)?
- User-Friendly Design: Tailored for both novices and seasoned professionals.
- Customizable Inputs: Adjust parameters effortlessly to suit your financial analysis.
- Real-Time Feedback: Observe immediate changes in SBI’s valuation as you modify the inputs.
- Preloaded Data: Comes with SBI’s latest financial information for swift evaluations.
- Preferred by Experts: Leveraged by investors and analysts for well-informed decision-making.
Who Should Utilize This Service?
- Investors: Evaluate SBI Sumishin Net Bank’s valuation before making stock transactions.
- CFOs and Financial Analysts: Enhance valuation workflows and assess financial forecasts.
- Startup Founders: Discover the valuation methodologies applied to leading financial institutions like SBI Sumishin Net Bank.
- Consultants: Create comprehensive valuation reports for your clients.
- Students and Educators: Utilize current market data to refine and instruct valuation practices.
Contents of the Template
- Pre-Filled DCF Model: SBI Sumishin Net Bank's financial data is preloaded for immediate application.
- WACC Calculator: Comprehensive calculations for the Weighted Average Cost of Capital.
- Financial Ratios: Assess SBI Sumishin Net Bank's profitability, leverage, and operational efficiency.
- Editable Inputs: Modify assumptions like growth rates, margins, and CAPEX to suit your analysis scenarios.
- Financial Statements: Annual and quarterly reports provided for in-depth examination.
- Interactive Dashboard: Effortlessly visualize essential valuation metrics and outcomes.
Disclaimer
All information, articles, and product details provided on this website are for general informational and educational purposes only. We do not claim any ownership over, nor do we intend to infringe upon, any trademarks, copyrights, logos, brand names, or other intellectual property mentioned or depicted on this site. Such intellectual property remains the property of its respective owners, and any references here are made solely for identification or informational purposes, without implying any affiliation, endorsement, or partnership.
We make no representations or warranties, express or implied, regarding the accuracy, completeness, or suitability of any content or products presented. Nothing on this website should be construed as legal, tax, investment, financial, medical, or other professional advice. In addition, no part of this site—including articles or product references—constitutes a solicitation, recommendation, endorsement, advertisement, or offer to buy or sell any securities, franchises, or other financial instruments, particularly in jurisdictions where such activity would be unlawful.
All content is of a general nature and may not address the specific circumstances of any individual or entity. It is not a substitute for professional advice or services. Any actions you take based on the information provided here are strictly at your own risk. You accept full responsibility for any decisions or outcomes arising from your use of this website and agree to release us from any liability in connection with your use of, or reliance upon, the content or products found herein.