
|
KYB Corporation (7242.T) Évaluation DCF |
Entièrement Modifiable: Adapté À Vos Besoins Dans Excel Ou Sheets
Conception Professionnelle: Modèles Fiables Et Conformes Aux Normes Du Secteur
Pré-Construits Pour Une Utilisation Rapide Et Efficace
Compatible MAC/PC, entièrement débloqué
Aucune Expertise N'Est Requise; Facile À Suivre
KYB Corporation (7242.T) Bundle
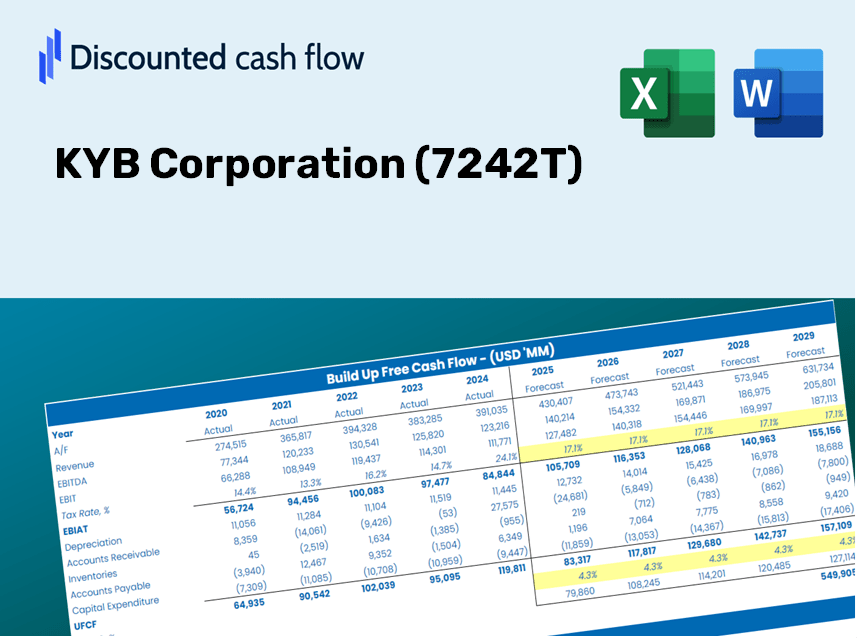
Que vous soyez un investisseur ou un analyste, cette (7242T) Calculator DCF est votre outil de référence pour une évaluation précise. Chargé de données réelles de KYB Corporation, vous pouvez ajuster les prévisions et observer immédiatement les effets.
Discounted Cash Flow (DCF) - (USD MM)
| Year | AY1 2020 |
AY2 2021 |
AY3 2022 |
AY4 2023 |
AY5 2024 |
FY1 2025 |
FY2 2026 |
FY3 2027 |
FY4 2028 |
FY5 2029 |
|---|---|---|---|---|---|---|---|---|---|---|
| Revenue | 328,037.0 | 388,360.0 | 431,205.0 | 442,781.0 | 438,316.0 | 472,392.4 | 509,118.0 | 548,698.8 | 591,356.7 | 637,331.1 |
| Revenue Growth, % | 0 | 18.39 | 11.03 | 2.68 | -1.01 | 7.77 | 7.77 | 7.77 | 7.77 | 7.77 |
| EBITDA | 37,748.0 | 48,518.0 | 50,882.0 | 40,950.0 | 40,585.0 | 51,309.3 | 55,298.3 | 59,597.4 | 64,230.7 | 69,224.2 |
| EBITDA, % | 11.51 | 12.49 | 11.8 | 9.25 | 9.26 | 10.86 | 10.86 | 10.86 | 10.86 | 10.86 |
| Depreciation | 18,634.0 | 18,314.0 | 18,652.0 | 18,886.0 | 18,685.0 | 21,966.2 | 23,673.9 | 25,514.4 | 27,498.0 | 29,635.8 |
| Depreciation, % | 5.68 | 4.72 | 4.33 | 4.27 | 4.26 | 4.65 | 4.65 | 4.65 | 4.65 | 4.65 |
| EBIT | 19,114.0 | 30,204.0 | 32,230.0 | 22,064.0 | 21,900.0 | 29,343.1 | 31,624.3 | 34,082.9 | 36,732.7 | 39,588.4 |
| EBIT, % | 5.83 | 7.78 | 7.47 | 4.98 | 5 | 6.21 | 6.21 | 6.21 | 6.21 | 6.21 |
| Total Cash | 69,812.0 | 54,873.0 | 47,751.0 | 46,637.0 | 47,428.0 | 64,092.6 | 69,075.4 | 74,445.5 | 80,233.2 | 86,470.9 |
| Total Cash, percent | .0 | .0 | .0 | .0 | .0 | .0 | .0 | .0 | .0 | .0 |
| Account Receivables | 98,898.0 | 108,823.0 | 120,247.0 | 123,700.0 | 109,876.0 | 131,382.4 | 141,596.6 | 152,604.9 | 164,469.0 | 177,255.4 |
| Account Receivables, % | 30.15 | 28.02 | 27.89 | 27.94 | 25.07 | 27.81 | 27.81 | 27.81 | 27.81 | 27.81 |
| Inventories | 53,997.0 | 66,114.0 | 70,535.0 | 70,020.0 | 67,604.0 | 76,602.6 | 82,558.0 | 88,976.4 | 95,893.8 | 103,348.9 |
| Inventories, % | 16.46 | 17.02 | 16.36 | 15.81 | 15.42 | 16.22 | 16.22 | 16.22 | 16.22 | 16.22 |
| Accounts Payable | 74,437.0 | 81,737.0 | 76,164.0 | 78,618.0 | 65,161.0 | 88,831.6 | 95,737.7 | 103,180.8 | 111,202.4 | 119,847.7 |
| Accounts Payable, % | 22.69 | 21.05 | 17.66 | 17.76 | 14.87 | 18.8 | 18.8 | 18.8 | 18.8 | 18.8 |
| Capital Expenditure | -11,248.0 | -9,296.0 | -11,624.0 | -24,612.0 | -17,049.0 | -16,974.4 | -18,294.0 | -19,716.3 | -21,249.1 | -22,901.1 |
| Capital Expenditure, % | -3.43 | -2.39 | -2.7 | -5.56 | -3.89 | -3.59 | -3.59 | -3.59 | -3.59 | -3.59 |
| Tax Rate, % | 24.17 | 24.17 | 24.17 | 24.17 | 24.17 | 24.17 | 24.17 | 24.17 | 24.17 | 24.17 |
| EBITAT | 19,987.8 | 23,634.3 | 27,604.0 | 16,338.6 | 16,607.5 | 24,283.2 | 26,171.0 | 28,205.7 | 30,398.5 | 32,761.8 |
| Depreciation | ||||||||||
| Changes in Account Receivables | ||||||||||
| Changes in Inventories | ||||||||||
| Changes in Accounts Payable | ||||||||||
| Capital Expenditure | ||||||||||
| UFCF | -51,084.2 | 17,910.3 | 13,214.0 | 10,128.6 | 21,026.5 | 22,440.6 | 22,287.5 | 24,020.2 | 25,887.6 | 27,900.2 |
| WACC, % | 7.52 | 7.25 | 7.35 | 7.2 | 7.22 | 7.31 | 7.31 | 7.31 | 7.31 | 7.31 |
| PV UFCF | ||||||||||
| SUM PV UFCF | 98,834.5 | |||||||||
| Long Term Growth Rate, % | 0.50 | |||||||||
| Free cash flow (T + 1) | 28,040 | |||||||||
| Terminal Value | 411,762 | |||||||||
| Present Terminal Value | 289,368 | |||||||||
| Enterprise Value | 388,203 | |||||||||
| Net Debt | 51,540 | |||||||||
| Equity Value | 336,663 | |||||||||
| Diluted Shares Outstanding, MM | 50 | |||||||||
| Equity Value Per Share | 6,777.58 |
What You'll Receive
- Pre-Filled Financial Model: Leverage KYB Corporation’s actual data for accurate DCF valuation.
- Comprehensive Forecast Control: Modify revenue growth rates, margins, WACC, and other vital parameters.
- Instantaneous Calculations: Automatic updates provide real-time results as you make adjustments.
- Investor-Ready Template: A polished Excel file tailored for high-quality valuation.
- Customizable and Reusable: Designed for flexibility, allowing for repeated use in detailed forecasting.
Key Features
- 🔍 Real-Life KYB Financials: Pre-filled historical and projected data for KYB Corporation (7242T).
- ✏️ Fully Customizable Inputs: Modify all essential parameters (yellow cells) such as WACC, growth %, and tax rates.
- 📊 Professional DCF Valuation: Integrated formulas compute KYB’s intrinsic value using the Discounted Cash Flow method.
- ⚡ Instant Results: Instantly visualize KYB’s valuation after any adjustments.
- Scenario Analysis: Evaluate and compare different outcomes for a variety of financial assumptions side-by-side.
How It Works
- Step 1: Download the Excel file.
- Step 2: Review the pre-filled KYB Corporation (7242T) data (historical and projected).
- Step 3: Modify key assumptions (highlighted in yellow) according to your analysis.
- Step 4: Observe the automatic recalculations for KYB Corporation’s intrinsic value.
- Step 5: Utilize the results for your investment decisions or reporting needs.
Why Opt for This Calculator?
- Reliable Data: Access accurate financial metrics for KYB Corporation (7242T) to achieve trustworthy valuation outcomes.
- Tailored Options: Modify essential factors such as growth rates, WACC, and tax rates to suit your forecasts.
- Efficient: Ready-made calculations help you avoid starting from the ground up.
- High-Quality Resource: Crafted for investors, analysts, and industry experts.
- Easy to Use: An intuitive design and clear, step-by-step guidance ensure accessibility for all users.
Who Can Benefit from KYB Corporation (7242T)?
- Investors: Gain insights and make informed decisions with our advanced valuation tool.
- Financial Analysts: Streamline your workflow with our customizable DCF model at your disposal.
- Consultants: Easily modify the template to suit client presentations and reports.
- Finance Enthusiasts: Enhance your knowledge of valuation methodologies through practical examples.
- Educators and Students: Utilize this resource as a hands-on learning aid in finance courses.
Contents of the Template
- Comprehensive DCF Model: Editable framework featuring thorough valuation calculations.
- Real-World Data: KYB Corporation’s historical and projected financials preloaded for your analysis.
- Customizable Parameters: Modify WACC, growth rates, and tax assumptions to explore various scenarios.
- Financial Statements: Complete annual and quarterly breakdowns for enhanced insights.
- Key Ratios: Integrated analysis for profitability, efficiency, and leverage metrics.
- Dashboard with Visual Outputs: Charts and tables for straightforward, actionable insights.
Disclaimer
All information, articles, and product details provided on this website are for general informational and educational purposes only. We do not claim any ownership over, nor do we intend to infringe upon, any trademarks, copyrights, logos, brand names, or other intellectual property mentioned or depicted on this site. Such intellectual property remains the property of its respective owners, and any references here are made solely for identification or informational purposes, without implying any affiliation, endorsement, or partnership.
We make no representations or warranties, express or implied, regarding the accuracy, completeness, or suitability of any content or products presented. Nothing on this website should be construed as legal, tax, investment, financial, medical, or other professional advice. In addition, no part of this site—including articles or product references—constitutes a solicitation, recommendation, endorsement, advertisement, or offer to buy or sell any securities, franchises, or other financial instruments, particularly in jurisdictions where such activity would be unlawful.
All content is of a general nature and may not address the specific circumstances of any individual or entity. It is not a substitute for professional advice or services. Any actions you take based on the information provided here are strictly at your own risk. You accept full responsibility for any decisions or outcomes arising from your use of this website and agree to release us from any liability in connection with your use of, or reliance upon, the content or products found herein.