
|
Daishi Hokuetsu Financial Group, Inc. (7327.T) Évaluation DCF |
Entièrement Modifiable: Adapté À Vos Besoins Dans Excel Ou Sheets
Conception Professionnelle: Modèles Fiables Et Conformes Aux Normes Du Secteur
Pré-Construits Pour Une Utilisation Rapide Et Efficace
Compatible MAC/PC, entièrement débloqué
Aucune Expertise N'Est Requise; Facile À Suivre
Daishi Hokuetsu Financial Group, Inc. (7327.T) Bundle
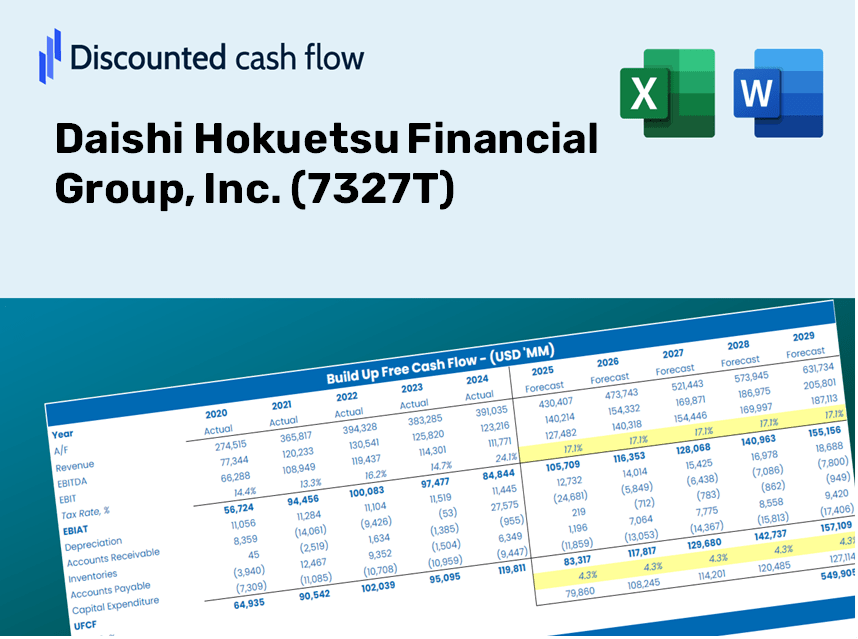
Gagnez la maîtrise sur votre analyse d'évaluation Daishi Hokuetsu Financial Group, Inc. (7327T) avec notre calculatrice DCF de pointe! Préchargé avec des données réelles (7327T), ce modèle Excel vous permet d'ajuster les prévisions et les hypothèses pour déterminer avec précision la valeur intrinsèque de Daishi Hokuetsu Financial Group, Inc.
Discounted Cash Flow (DCF) - (USD MM)
| Year | AY1 2020 |
AY2 2021 |
AY3 2022 |
AY4 2023 |
AY5 2024 |
FY1 2025 |
FY2 2026 |
FY3 2027 |
FY4 2028 |
FY5 2029 |
|---|---|---|---|---|---|---|---|---|---|---|
| Revenue | 134,079.0 | 127,504.0 | 140,486.0 | 170,532.0 | 182,833.0 | 198,318.2 | 215,114.9 | 233,334.2 | 253,096.6 | 274,532.9 |
| Revenue Growth, % | 0 | -4.9 | 10.18 | 21.39 | 7.21 | 8.47 | 8.47 | 8.47 | 8.47 | 8.47 |
| EBITDA | 23,962.0 | 30,301.0 | 31,908.0 | 36,842.0 | 48,197.0 | 44,547.9 | 48,320.9 | 52,413.5 | 56,852.7 | 61,667.9 |
| EBITDA, % | 17.87 | 23.76 | 22.71 | 21.6 | 26.36 | 22.46 | 22.46 | 22.46 | 22.46 | 22.46 |
| Depreciation | 6,241.0 | 6,959.0 | 6,959.0 | 7,081.0 | 7,021.0 | 9,145.8 | 9,920.5 | 10,760.7 | 11,672.1 | 12,660.6 |
| Depreciation, % | 4.65 | 5.46 | 4.95 | 4.15 | 3.84 | 4.61 | 4.61 | 4.61 | 4.61 | 4.61 |
| EBIT | 17,721.0 | 23,342.0 | 24,949.0 | 29,761.0 | 41,176.0 | 35,402.1 | 38,400.5 | 41,652.8 | 45,180.7 | 49,007.3 |
| EBIT, % | 13.22 | 18.31 | 17.76 | 17.45 | 22.52 | 17.85 | 17.85 | 17.85 | 17.85 | 17.85 |
| Total Cash | 2,055,703.0 | 2,758,985.0 | 2,031,509.0 | 2,230,849.0 | 2,147,289.0 | 198,318.2 | 215,114.9 | 233,334.2 | 253,096.6 | 274,532.9 |
| Total Cash, percent | .0 | .0 | .0 | .0 | .0 | .0 | .0 | .0 | .0 | .0 |
| Account Receivables | .0 | .0 | .0 | .0 | .0 | .0 | .0 | .0 | .0 | .0 |
| Account Receivables, % | 0 | 0 | 0 | 0 | 0 | 0 | 0 | 0 | 0 | 0 |
| Inventories | .0 | .0 | .0 | .0 | .0 | .0 | .0 | .0 | .0 | .0 |
| Inventories, % | 0 | 0 | 0 | 0 | 0 | 0 | 0 | 0 | 0 | 0 |
| Accounts Payable | .0 | .0 | .0 | .0 | .0 | .0 | .0 | .0 | .0 | .0 |
| Accounts Payable, % | 0 | 0 | 0 | 0 | 0 | 0 | 0 | 0 | 0 | 0 |
| Capital Expenditure | -8,399.0 | -2,827.0 | -5,319.0 | -5,124.0 | -2,084.0 | -6,509.6 | -7,061.0 | -7,659.0 | -8,307.7 | -9,011.3 |
| Capital Expenditure, % | -6.26 | -2.22 | -3.79 | -3 | -1.14 | -3.28 | -3.28 | -3.28 | -3.28 | -3.28 |
| Tax Rate, % | 28.72 | 28.72 | 28.72 | 28.72 | 28.72 | 28.72 | 28.72 | 28.72 | 28.72 | 28.72 |
| EBITAT | 10,795.0 | 15,144.0 | 17,768.0 | 21,205.1 | 29,349.0 | 24,040.9 | 26,077.1 | 28,285.7 | 30,681.4 | 33,279.9 |
| Depreciation | ||||||||||
| Changes in Account Receivables | ||||||||||
| Changes in Inventories | ||||||||||
| Changes in Accounts Payable | ||||||||||
| Capital Expenditure | ||||||||||
| UFCF | 8,637.0 | 19,276.0 | 19,408.0 | 23,162.1 | 34,286.0 | 26,677.1 | 28,936.5 | 31,387.4 | 34,045.7 | 36,929.3 |
| WACC, % | 2.73 | 2.85 | 3.03 | 3.03 | 3.03 | 2.93 | 2.93 | 2.93 | 2.93 | 2.93 |
| PV UFCF | ||||||||||
| SUM PV UFCF | 144,296.2 | |||||||||
| Long Term Growth Rate, % | 2.00 | |||||||||
| Free cash flow (T + 1) | 37,668 | |||||||||
| Terminal Value | 4,038,197 | |||||||||
| Present Terminal Value | 3,494,772 | |||||||||
| Enterprise Value | 3,639,068 | |||||||||
| Net Debt | -1,161,431 | |||||||||
| Equity Value | 4,800,499 | |||||||||
| Diluted Shares Outstanding, MM | 262 | |||||||||
| Equity Value Per Share | 18,314.83 |
What You Will Receive
- Customizable Forecast Inputs: Effortlessly adjust assumptions (growth %, margins, WACC) to explore various scenarios.
- Comprehensive Financial Data: Daishi Hokuetsu Financial Group, Inc.'s (7327T) financial information pre-loaded to facilitate your analysis.
- Automated DCF Calculations: The template computes Net Present Value (NPV) and intrinsic value for you automatically.
- Sleek and Adaptable Design: A refined Excel model that caters to your valuation requirements.
- Engineered for Analysts and Investors: Perfect for evaluating forecasts, confirming strategies, and enhancing efficiency.
Key Features
- 🔍 Real-Life (7327T) Financials: Pre-filled historical and projected data for Daishi Hokuetsu Financial Group, Inc.
- ✏️ Fully Customizable Inputs: Modify all essential parameters (yellow cells) such as WACC, growth %, and tax rates.
- 📊 Professional DCF Valuation: Integrated formulas assess Daishi Hokuetsu’s intrinsic value using the Discounted Cash Flow method.
- ⚡ Instant Results: Visualize Daishi Hokuetsu’s valuation immediately after adjustments.
- Scenario Analysis: Evaluate and compare outcomes for different financial assumptions side-by-side.
How It Works
- Step 1: Download the prebuilt Excel template containing Daishi Hokuetsu Financial Group, Inc.'s (7327T) data.
- Step 2: Review the pre-filled sheets to get familiar with the essential metrics.
- Step 3: Modify forecasts and assumptions in the editable yellow cells (WACC, growth, margins).
- Step 4: Instantly see the updated results, including Daishi Hokuetsu Financial Group, Inc.'s (7327T) intrinsic value.
- Step 5: Utilize the outputs to make well-informed investment decisions or create reports.
Why Opt for This Calculator?
- All-in-One Solution: Features DCF, WACC, and financial ratio analyses all in one integrated tool.
- Flexible Inputs: Modify the yellow-highlighted fields to explore different scenarios.
- In-Depth Analysis: Automatically determines the intrinsic value and Net Present Value for Daishi Hokuetsu Financial Group, Inc. (7327T).
- Preloaded Information: Includes historical and projected data for precise baseline calculations.
- High-Quality Standards: Perfect for financial analysts, investors, and business consultants seeking reliable insights.
Who Should Benefit from This Product?
- Investors: Accurately assess Daishi Hokuetsu Financial Group, Inc.'s (7327T) fair value prior to making investment choices.
- CFOs: Utilize a high-caliber DCF model for financial analysis and reporting.
- Consultants: Efficiently customize the template for valuation reports tailored to clients.
- Entrepreneurs: Acquire knowledge on financial modeling practices adopted by leading financial institutions.
- Educators: Employ it as an educational resource to illustrate various valuation techniques.
Contents of the Template
- Preloaded DHFG Data: Historical and projected financial figures, including revenue, EBIT, and capital expenditures.
- DCF and WACC Models: Professional-grade spreadsheets designed for determining intrinsic value and Weighted Average Cost of Capital.
- Editable Inputs: Yellow-highlighted cells available for modifying revenue growth, tax rates, and discount rates.
- Financial Statements: Comprehensive annual and quarterly financial statements for in-depth analysis.
- Key Ratios: Profitability, leverage, and efficiency ratios for assessing performance.
- Dashboard and Charts: Visual summaries showcasing valuation results and underlying assumptions.
Disclaimer
All information, articles, and product details provided on this website are for general informational and educational purposes only. We do not claim any ownership over, nor do we intend to infringe upon, any trademarks, copyrights, logos, brand names, or other intellectual property mentioned or depicted on this site. Such intellectual property remains the property of its respective owners, and any references here are made solely for identification or informational purposes, without implying any affiliation, endorsement, or partnership.
We make no representations or warranties, express or implied, regarding the accuracy, completeness, or suitability of any content or products presented. Nothing on this website should be construed as legal, tax, investment, financial, medical, or other professional advice. In addition, no part of this site—including articles or product references—constitutes a solicitation, recommendation, endorsement, advertisement, or offer to buy or sell any securities, franchises, or other financial instruments, particularly in jurisdictions where such activity would be unlawful.
All content is of a general nature and may not address the specific circumstances of any individual or entity. It is not a substitute for professional advice or services. Any actions you take based on the information provided here are strictly at your own risk. You accept full responsibility for any decisions or outcomes arising from your use of this website and agree to release us from any liability in connection with your use of, or reliance upon, the content or products found herein.