
|
Nojima Corporation (7419.T) Évaluation DCF |
Entièrement Modifiable: Adapté À Vos Besoins Dans Excel Ou Sheets
Conception Professionnelle: Modèles Fiables Et Conformes Aux Normes Du Secteur
Pré-Construits Pour Une Utilisation Rapide Et Efficace
Compatible MAC/PC, entièrement débloqué
Aucune Expertise N'Est Requise; Facile À Suivre
Nojima Corporation (7419.T) Bundle
Évaluez les perspectives financières de Nojima Corporation comme un expert! Ce (7419t) Calculator DCF propose des données financières pré-remplies et la flexibilité pour modifier la croissance des revenus, le WACC, les marges et d'autres hypothèses essentielles pour s'aligner sur vos projections.
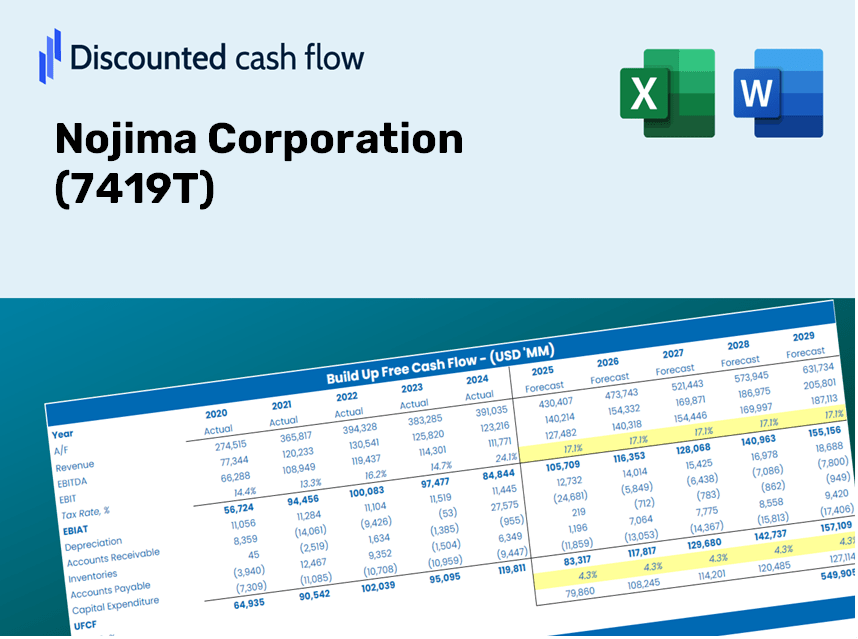
Discounted Cash Flow (DCF) - (USD MM)
| Year | AY1 2020 |
AY2 2021 |
AY3 2022 |
AY4 2023 |
AY5 2024 |
FY1 2025 |
FY2 2026 |
FY3 2027 |
FY4 2028 |
FY5 2029 |
|---|---|---|---|---|---|---|---|---|---|---|
| Revenue | 523,327.0 | 564,989.0 | 626,181.0 | 761,301.0 | 853,427.0 | 965,377.8 | 1,092,014.2 | 1,235,262.4 | 1,397,301.6 | 1,580,596.8 |
| Revenue Growth, % | 0 | 7.96 | 10.83 | 21.58 | 12.1 | 13.12 | 13.12 | 13.12 | 13.12 | 13.12 |
| EBITDA | 79,427.0 | 55,619.0 | 53,938.0 | 55,628.0 | 74,887.0 | 95,991.8 | 108,583.8 | 122,827.6 | 138,939.9 | 157,165.7 |
| EBITDA, % | 15.18 | 9.84 | 8.61 | 7.31 | 8.77 | 9.94 | 9.94 | 9.94 | 9.94 | 9.94 |
| Depreciation | 14,941.0 | 16,264.0 | 17,259.0 | 21,998.0 | 23,605.0 | 27,311.1 | 30,893.8 | 34,946.3 | 39,530.5 | 44,716.1 |
| Depreciation, % | 2.86 | 2.88 | 2.76 | 2.89 | 2.77 | 2.83 | 2.83 | 2.83 | 2.83 | 2.83 |
| EBIT | 64,486.0 | 39,355.0 | 36,679.0 | 33,630.0 | 51,282.0 | 68,680.6 | 77,690.0 | 87,881.2 | 99,409.3 | 112,449.7 |
| EBIT, % | 12.32 | 6.97 | 5.86 | 4.42 | 6.01 | 7.11 | 7.11 | 7.11 | 7.11 | 7.11 |
| Total Cash | 18,513.0 | 51,004.0 | 129,457.0 | 69,661.0 | 90,118.0 | 102,231.3 | 115,641.8 | 130,811.4 | 147,971.0 | 167,381.6 |
| Total Cash, percent | .0 | .0 | .0 | .0 | .0 | .0 | .0 | .0 | .0 | .0 |
| Account Receivables | 78,491.0 | 75,529.0 | 126,005.0 | 117,334.0 | 139,255.0 | 154,883.1 | 175,200.4 | 198,182.8 | 224,180.0 | 253,587.5 |
| Account Receivables, % | 15 | 13.37 | 20.12 | 15.41 | 16.32 | 16.04 | 16.04 | 16.04 | 16.04 | 16.04 |
| Inventories | 49,460.0 | 50,735.0 | 69,338.0 | 67,469.0 | 78,340.0 | 91,799.4 | 103,841.5 | 117,463.2 | 132,871.7 | 150,301.6 |
| Inventories, % | 9.45 | 8.98 | 11.07 | 8.86 | 9.18 | 9.51 | 9.51 | 9.51 | 9.51 | 9.51 |
| Accounts Payable | 54,806.0 | 57,151.0 | 75,549.0 | 80,893.0 | 94,304.0 | 104,895.5 | 118,655.5 | 134,220.5 | 151,827.3 | 171,743.6 |
| Accounts Payable, % | 10.47 | 10.12 | 12.07 | 10.63 | 11.05 | 10.87 | 10.87 | 10.87 | 10.87 | 10.87 |
| Capital Expenditure | -4,982.0 | -13,357.0 | -5,985.0 | -6,073.0 | -7,534.0 | -11,492.6 | -13,000.2 | -14,705.6 | -16,634.6 | -18,816.7 |
| Capital Expenditure, % | -0.95199 | -2.36 | -0.95579 | -0.79771 | -0.88279 | -1.19 | -1.19 | -1.19 | -1.19 | -1.19 |
| Tax Rate, % | 35.6 | 35.6 | 35.6 | 35.6 | 35.6 | 35.6 | 35.6 | 35.6 | 35.6 | 35.6 |
| EBITAT | 53,390.0 | 26,296.3 | 23,681.1 | 20,432.9 | 33,025.5 | 46,611.1 | 52,725.4 | 59,641.9 | 67,465.6 | 76,315.5 |
| Depreciation | ||||||||||
| Changes in Account Receivables | ||||||||||
| Changes in Inventories | ||||||||||
| Changes in Accounts Payable | ||||||||||
| Capital Expenditure | ||||||||||
| UFCF | -9,796.0 | 33,235.3 | -15,725.9 | 52,241.9 | 29,715.5 | 43,933.6 | 52,019.6 | 58,843.5 | 66,562.4 | 75,294.0 |
| WACC, % | 4.33 | 4.21 | 4.2 | 4.17 | 4.2 | 4.22 | 4.22 | 4.22 | 4.22 | 4.22 |
| PV UFCF | ||||||||||
| SUM PV UFCF | 259,668.8 | |||||||||
| Long Term Growth Rate, % | 0.50 | |||||||||
| Free cash flow (T + 1) | 75,670 | |||||||||
| Terminal Value | 2,033,197 | |||||||||
| Present Terminal Value | 1,653,437 | |||||||||
| Enterprise Value | 1,913,106 | |||||||||
| Net Debt | 21,001 | |||||||||
| Equity Value | 1,892,105 | |||||||||
| Diluted Shares Outstanding, MM | 303 | |||||||||
| Equity Value Per Share | 6,240.00 |
What You Will Receive
- Pre-Configured Financial Model: Utilizing Nojima Corporation’s (7419T) actual data for accurate DCF valuations.
- Comprehensive Forecast Control: Modify revenue growth, profit margins, WACC, and other essential metrics.
- Real-Time Calculations: Automatic updates provide immediate feedback as adjustments are made.
- Professional-Grade Template: A polished Excel file crafted for high-quality valuation presentations.
- Flexible and Reusable: Designed for adaptability, allowing for continuous use in detailed forecasting.
Key Features
- Comprehensive DCF Calculator: Offers detailed unlevered and levered DCF valuation frameworks tailored for Nojima Corporation (7419T).
- WACC Calculator: Features a pre-built Weighted Average Cost of Capital sheet with adjustable parameters.
- Customizable Forecast Inputs: Easily alter growth projections, capital expenditures, and discount rates.
- Integrated Financial Ratios: Evaluate profitability, leverage, and efficiency metrics specifically for Nojima Corporation (7419T).
- Visual Dashboard and Charts: Graphical representations summarize essential valuation indicators for straightforward analysis.
How It Functions
- Download: Obtain the pre-prepared Excel file containing Nojima Corporation's (7419T) financial data.
- Customize: Modify projections such as revenue growth, EBITDA %, and WACC as needed.
- Real-Time Updates: The intrinsic value and NPV calculations refresh automatically.
- Scenario Testing: Generate various projections and analyze results side by side instantly.
- Informed Decisions: Leverage the valuation findings to shape your investment approach.
Why Opt for Nojima Corporation’s [Symbol] Calculator?
- Precision: Utilizing authentic Nojima financials guarantees accurate data.
- Versatility: Tailored for users to effortlessly test and adjust inputs.
- Efficiency: Eliminate the need to construct a DCF model from the ground up.
- Expert-Level: Created with the precision and usability expected from CFOs.
- Accessible: Simple to navigate, even for those with limited financial modeling skills.
Who Should Utilize This Product?
- Investors: Accurately assess Nojima Corporation’s (7419T) fair value prior to making investment choices.
- CFOs: Utilize a professional-grade DCF model for comprehensive financial reporting and analysis.
- Consultants: Efficiently customize the template for client valuation reports.
- Entrepreneurs: Acquire insights into the financial modeling techniques employed by leading companies.
- Educators: Employ it as a teaching resource to showcase valuation methodologies.
Contents of the Template
- Pre-Filled Data: Contains Nojima Corporation’s (7419T) historical financial data and projections.
- Discounted Cash Flow Model: An editable DCF valuation model with automatic computations.
- Weighted Average Cost of Capital (WACC): A dedicated worksheet for calculating WACC using customized inputs.
- Key Financial Ratios: Evaluate Nojima Corporation’s (7419T) profitability, efficiency, and financial leverage.
- Customizable Inputs: Easily adjust revenue growth, profit margins, and tax rates.
- Clear Dashboard: Visual charts and tables summarizing the key valuation outcomes.
Disclaimer
All information, articles, and product details provided on this website are for general informational and educational purposes only. We do not claim any ownership over, nor do we intend to infringe upon, any trademarks, copyrights, logos, brand names, or other intellectual property mentioned or depicted on this site. Such intellectual property remains the property of its respective owners, and any references here are made solely for identification or informational purposes, without implying any affiliation, endorsement, or partnership.
We make no representations or warranties, express or implied, regarding the accuracy, completeness, or suitability of any content or products presented. Nothing on this website should be construed as legal, tax, investment, financial, medical, or other professional advice. In addition, no part of this site—including articles or product references—constitutes a solicitation, recommendation, endorsement, advertisement, or offer to buy or sell any securities, franchises, or other financial instruments, particularly in jurisdictions where such activity would be unlawful.
All content is of a general nature and may not address the specific circumstances of any individual or entity. It is not a substitute for professional advice or services. Any actions you take based on the information provided here are strictly at your own risk. You accept full responsibility for any decisions or outcomes arising from your use of this website and agree to release us from any liability in connection with your use of, or reliance upon, the content or products found herein.