
|
Ryohin Keikaku Co., Ltd. (7453.T) Évaluation DCF |
Entièrement Modifiable: Adapté À Vos Besoins Dans Excel Ou Sheets
Conception Professionnelle: Modèles Fiables Et Conformes Aux Normes Du Secteur
Pré-Construits Pour Une Utilisation Rapide Et Efficace
Compatible MAC/PC, entièrement débloqué
Aucune Expertise N'Est Requise; Facile À Suivre
Ryohin Keikaku Co., Ltd. (7453.T) Bundle
Vous cherchez à évaluer la valeur intrinsèque de Ryohin Keikaku Co., Ltd.? Notre (7453T) Calculator DCF intègre des données réelles avec des fonctionnalités de personnalisation complètes, vous permettant d'affiner les prévisions et d'améliorer vos stratégies d'investissement.
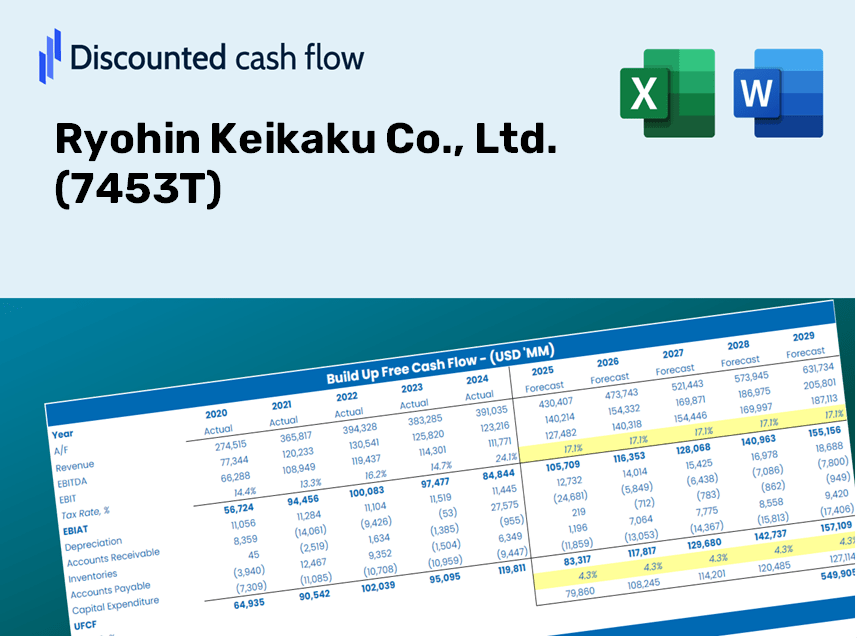
Discounted Cash Flow (DCF) - (USD MM)
| Year | AY1 2020 |
AY2 2021 |
AY3 2022 |
AY4 2023 |
AY5 2024 |
FY1 2025 |
FY2 2026 |
FY3 2027 |
FY4 2028 |
FY5 2029 |
|---|---|---|---|---|---|---|---|---|---|---|
| Revenue | 437,775.0 | 453,689.0 | 496,171.0 | 581,412.0 | 661,677.0 | 690,492.6 | 720,563.1 | 751,943.1 | 784,689.7 | 818,862.4 |
| Revenue Growth, % | 0 | 3.64 | 9.36 | 17.18 | 13.81 | 4.35 | 4.35 | 4.35 | 4.35 | 4.35 |
| EBITDA | 54,346.0 | 70,106.0 | 57,842.0 | 61,500.0 | 91,114.0 | 88,206.4 | 92,047.8 | 96,056.4 | 100,239.6 | 104,604.9 |
| EBITDA, % | 12.41 | 15.45 | 11.66 | 10.58 | 13.77 | 12.77 | 12.77 | 12.77 | 12.77 | 12.77 |
| Depreciation | 18,851.0 | 20,122.0 | 23,286.0 | 26,070.0 | 28,974.0 | 30,792.1 | 32,133.1 | 33,532.5 | 34,992.8 | 36,516.7 |
| Depreciation, % | 4.31 | 4.44 | 4.69 | 4.48 | 4.38 | 4.46 | 4.46 | 4.46 | 4.46 | 4.46 |
| EBIT | 35,495.0 | 49,984.0 | 34,556.0 | 35,430.0 | 62,140.0 | 57,414.3 | 59,914.7 | 62,523.9 | 65,246.8 | 68,088.2 |
| EBIT, % | 8.11 | 11.02 | 6.96 | 6.09 | 9.39 | 8.31 | 8.31 | 8.31 | 8.31 | 8.31 |
| Total Cash | 38,814.0 | 135,752.0 | 90,162.0 | 115,038.0 | 125,225.0 | 132,120.2 | 137,873.9 | 143,878.2 | 150,144.0 | 156,682.7 |
| Total Cash, percent | .0 | .0 | .0 | .0 | .0 | .0 | .0 | .0 | .0 | .0 |
| Account Receivables | 21,608.0 | 20,578.0 | 26,097.0 | 25,217.0 | 16,798.0 | 29,839.2 | 31,138.6 | 32,494.7 | 33,909.8 | 35,386.6 |
| Account Receivables, % | 4.94 | 4.54 | 5.26 | 4.34 | 2.54 | 4.32 | 4.32 | 4.32 | 4.32 | 4.32 |
| Inventories | 105,414.0 | 106,459.0 | 129,558.0 | 133,296.0 | 154,020.0 | 165,524.5 | 172,733.0 | 180,255.4 | 188,105.4 | 196,297.2 |
| Inventories, % | 24.08 | 23.47 | 26.11 | 22.93 | 23.28 | 23.97 | 23.97 | 23.97 | 23.97 | 23.97 |
| Accounts Payable | 28,133.0 | 25,541.0 | 36,462.0 | 35,157.0 | 59,168.0 | 47,497.1 | 49,565.5 | 51,724.1 | 53,976.6 | 56,327.3 |
| Accounts Payable, % | 6.43 | 5.63 | 7.35 | 6.05 | 8.94 | 6.88 | 6.88 | 6.88 | 6.88 | 6.88 |
| Capital Expenditure | -30,013.0 | -18,923.0 | -17,679.0 | -26,374.0 | -38,933.0 | -34,538.4 | -36,042.6 | -37,612.2 | -39,250.2 | -40,959.5 |
| Capital Expenditure, % | -6.86 | -4.17 | -3.56 | -4.54 | -5.88 | -5 | -5 | -5 | -5 | -5 |
| Tax Rate, % | 30.62 | 30.62 | 30.62 | 30.62 | 30.62 | 30.62 | 30.62 | 30.62 | 30.62 | 30.62 |
| EBITAT | 23,852.4 | 34,876.4 | 25,558.0 | 23,138.0 | 43,110.3 | 39,686.8 | 41,415.2 | 43,218.8 | 45,100.9 | 47,065.0 |
| Depreciation | ||||||||||
| Changes in Account Receivables | ||||||||||
| Changes in Inventories | ||||||||||
| Changes in Accounts Payable | ||||||||||
| Capital Expenditure | ||||||||||
| UFCF | -86,198.6 | 33,468.4 | 13,468.0 | 18,671.0 | 44,857.3 | -276.1 | 31,066.2 | 32,419.1 | 33,831.0 | 35,304.3 |
| WACC, % | 4.5 | 4.51 | 4.53 | 4.5 | 4.51 | 4.51 | 4.51 | 4.51 | 4.51 | 4.51 |
| PV UFCF | ||||||||||
| SUM PV UFCF | 113,247.0 | |||||||||
| Long Term Growth Rate, % | 2.70 | |||||||||
| Free cash flow (T + 1) | 36,257 | |||||||||
| Terminal Value | 2,001,108 | |||||||||
| Present Terminal Value | 1,604,880 | |||||||||
| Enterprise Value | 1,718,127 | |||||||||
| Net Debt | -33,156 | |||||||||
| Equity Value | 1,751,283 | |||||||||
| Diluted Shares Outstanding, MM | 265 | |||||||||
| Equity Value Per Share | 6,602.58 |
Your Benefits
- Pre-Loaded Financial Model: Ryohin Keikaku's actual data enables accurate DCF valuation.
- Comprehensive Forecast Control: Modify revenue growth, profit margins, WACC, and other essential metrics.
- Real-Time Calculations: Automatic updates provide immediate insights as you adjust parameters.
- Investor-Ready Framework: A polished Excel file crafted for high-quality valuations.
- Flexible and Reusable: Designed for ease of customization, facilitating repeated use for in-depth forecasts.
Key Features
- Customizable Forecast Inputs: Adjust essential parameters such as sales growth, operating margin, and investment expenditures.
- Instant DCF Valuation: Quickly generates intrinsic value estimates, NPV, and various financial metrics.
- High-Precision Accuracy: Leverages Ryohin Keikaku's real-world financial data for credible valuation results.
- Seamless Scenario Analysis: Effortlessly evaluate alternative assumptions and analyze different outcomes.
- Efficiency Booster: Streamlines the valuation process, eliminating the need for complex model construction from the ground up.
How It Functions
- Download the Template: Gain immediate access to the Excel-based Ryohin Keikaku (7453T) DCF Calculator.
- Input Your Assumptions: Modify the yellow-highlighted cells to set your growth rates, WACC, profit margins, and additional parameters.
- Instant Calculations: The model will automatically recalculate Ryohin Keikaku’s intrinsic value based on your inputs.
- Test Scenarios: Explore various assumptions to assess potential changes in valuation.
- Analyze and Decide: Utilize the outcomes to inform your investment strategy or financial assessments.
Why Choose This Calculator for Ryohin Keikaku Co., Ltd. (7453T)?
- All-in-One Solution: Features DCF, WACC, and financial ratio analyses integrated into a single tool.
- Flexible Inputs: Modify the yellow-highlighted fields to explore different scenarios.
- In-Depth Analysis: Automatically determines Ryohin Keikaku’s intrinsic value and Net Present Value.
- Included Data: Access historical and forecasted data for reliable starting points.
- High-Quality Standard: Perfect for financial analysts, investors, and business advisors.
Who Should Use This Product?
- Individual Investors: Make informed decisions about buying or selling Ryohin Keikaku Co., Ltd. (7453T) stock.
- Financial Analysts: Enhance valuation workflows with comprehensive financial models for Ryohin Keikaku Co., Ltd. (7453T).
- Consultants: Provide clients with accurate and timely valuation insights related to Ryohin Keikaku Co., Ltd. (7453T).
- Business Owners: Gain insights into the valuation methods of large companies like Ryohin Keikaku Co., Ltd. (7453T) to inform your own business strategy.
- Finance Students: Acquire practical knowledge of valuation techniques through the analysis of Ryohin Keikaku Co., Ltd. (7453T) and similar real-world examples.
Contents of the Template
- Historical Data: Contains Ryohin Keikaku Co., Ltd.'s past financial performance and baseline forecasts.
- DCF and Levered DCF Models: Comprehensive templates for calculating the intrinsic value of Ryohin Keikaku Co., Ltd. (7453T).
- WACC Sheet: Preconfigured calculations for the Weighted Average Cost of Capital.
- Editable Inputs: Adjust key variables such as growth rates, EBITDA %, and CAPEX assumptions.
- Quarterly and Annual Statements: A detailed breakdown of Ryohin Keikaku Co., Ltd.'s financial statements.
- Interactive Dashboard: Dynamically visualize valuation results and future projections.
Disclaimer
All information, articles, and product details provided on this website are for general informational and educational purposes only. We do not claim any ownership over, nor do we intend to infringe upon, any trademarks, copyrights, logos, brand names, or other intellectual property mentioned or depicted on this site. Such intellectual property remains the property of its respective owners, and any references here are made solely for identification or informational purposes, without implying any affiliation, endorsement, or partnership.
We make no representations or warranties, express or implied, regarding the accuracy, completeness, or suitability of any content or products presented. Nothing on this website should be construed as legal, tax, investment, financial, medical, or other professional advice. In addition, no part of this site—including articles or product references—constitutes a solicitation, recommendation, endorsement, advertisement, or offer to buy or sell any securities, franchises, or other financial instruments, particularly in jurisdictions where such activity would be unlawful.
All content is of a general nature and may not address the specific circumstances of any individual or entity. It is not a substitute for professional advice or services. Any actions you take based on the information provided here are strictly at your own risk. You accept full responsibility for any decisions or outcomes arising from your use of this website and agree to release us from any liability in connection with your use of, or reliance upon, the content or products found herein.