
|
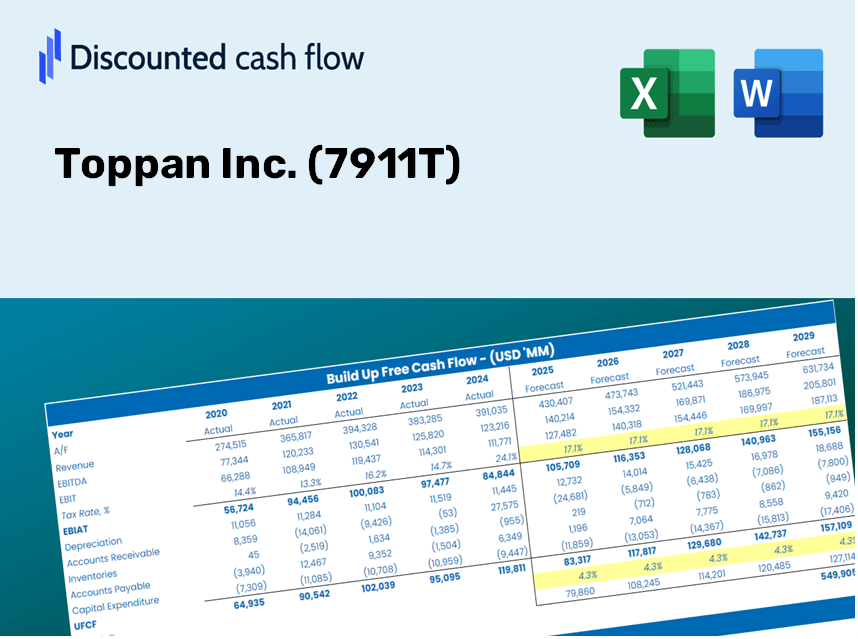
Toppan Inc. (7911.T) Valation DCF |
Entièrement Modifiable: Adapté À Vos Besoins Dans Excel Ou Sheets
Conception Professionnelle: Modèles Fiables Et Conformes Aux Normes Du Secteur
Pré-Construits Pour Une Utilisation Rapide Et Efficace
Compatible MAC/PC, entièrement débloqué
Aucune Expertise N'Est Requise; Facile À Suivre
Toppan Inc. (7911.T) Bundle
Explorez les perspectives financières de Toppan Inc. (7911T) avec notre calculatrice DCF conviviale! Entrez vos projections pour la croissance, les marges et les dépenses pour déterminer la valeur intrinsèque de Toppan Inc. (7911T) et façonner votre approche d'investissement.
Discounted Cash Flow (DCF) - (USD MM)
| Year | AY1 2021 |
AY2 2022 |
AY3 2023 |
AY4 2024 |
AY5 2025 |
FY1 2026 |
FY2 2027 |
FY3 2028 |
FY4 2029 |
FY5 2030 |
|---|---|---|---|---|---|---|---|---|---|---|
| Revenue | 1,466,935.0 | 1,547,533.0 | 1,638,833.0 | 1,678,249.0 | 1,717,960.0 | 1,787,388.6 | 1,859,623.1 | 1,934,776.9 | 2,012,967.8 | 2,094,318.7 |
| Revenue Growth, % | 0 | 5.49 | 5.9 | 2.41 | 2.37 | 4.04 | 4.04 | 4.04 | 4.04 | 4.04 |
| EBITDA | 198,960.0 | 251,511.0 | 189,327.0 | 218,123.0 | 258,587.0 | 248,150.1 | 258,178.7 | 268,612.6 | 279,468.2 | 290,762.4 |
| EBITDA, % | 13.56 | 16.25 | 11.55 | 13 | 15.05 | 13.88 | 13.88 | 13.88 | 13.88 | 13.88 |
| Depreciation | 64,883.0 | 66,581.0 | 75,464.0 | 86,876.0 | 81,498.0 | 83,115.8 | 86,474.8 | 89,969.6 | 93,605.6 | 97,388.5 |
| Depreciation, % | 4.42 | 4.3 | 4.6 | 5.18 | 4.74 | 4.65 | 4.65 | 4.65 | 4.65 | 4.65 |
| EBIT | 134,077.0 | 184,930.0 | 113,863.0 | 131,247.0 | 177,089.0 | 165,034.3 | 171,703.9 | 178,643.0 | 185,862.6 | 193,373.9 |
| EBIT, % | 9.14 | 11.95 | 6.95 | 7.82 | 10.31 | 9.23 | 9.23 | 9.23 | 9.23 | 9.23 |
| Total Cash | 543,390.0 | 464,653.0 | 504,921.0 | 558,028.0 | 778,589.0 | 630,765.5 | 656,256.9 | 682,778.5 | 710,371.9 | 739,080.4 |
| Total Cash, percent | .0 | .0 | .0 | .0 | .0 | .0 | .0 | .0 | .0 | .0 |
| Account Receivables | 390,332.0 | 423,713.0 | 419,347.0 | 435,569.0 | 432,603.0 | 467,265.2 | 486,149.0 | 505,796.0 | 526,236.9 | 547,503.9 |
| Account Receivables, % | 26.61 | 27.38 | 25.59 | 25.95 | 25.18 | 26.14 | 26.14 | 26.14 | 26.14 | 26.14 |
| Inventories | 103,570.0 | 124,457.0 | 142,330.0 | 148,302.0 | 140,627.0 | 145,886.0 | 151,781.8 | 157,915.8 | 164,297.7 | 170,937.6 |
| Inventories, % | 7.06 | 8.04 | 8.68 | 8.84 | 8.19 | 8.16 | 8.16 | 8.16 | 8.16 | 8.16 |
| Accounts Payable | 139,664.0 | 151,743.0 | 162,517.0 | 205,762.0 | 178,688.0 | 185,547.4 | 193,046.0 | 200,847.6 | 208,964.6 | 217,409.6 |
| Accounts Payable, % | 9.52 | 9.81 | 9.92 | 12.26 | 10.4 | 10.38 | 10.38 | 10.38 | 10.38 | 10.38 |
| Capital Expenditure | -56,607.0 | -42,539.0 | -65,394.0 | -81,776.0 | -123,128.0 | -80,925.0 | -84,195.4 | -87,598.1 | -91,138.2 | -94,821.4 |
| Capital Expenditure, % | -3.86 | -2.75 | -3.99 | -4.87 | -7.17 | -4.53 | -4.53 | -4.53 | -4.53 | -4.53 |
| Tax Rate, % | 51.48 | 51.48 | 51.48 | 51.48 | 51.48 | 51.48 | 51.48 | 51.48 | 51.48 | 51.48 |
| EBITAT | 84,555.5 | 125,896.3 | 63,257.7 | 77,694.7 | 85,929.5 | 97,178.6 | 101,105.9 | 105,191.9 | 109,443.1 | 113,866.0 |
| Depreciation | ||||||||||
| Changes in Account Receivables | ||||||||||
| Changes in Inventories | ||||||||||
| Changes in Accounts Payable | ||||||||||
| Capital Expenditure | ||||||||||
| UFCF | -261,406.5 | 107,749.3 | 70,594.7 | 103,845.7 | 27,866.5 | 66,307.5 | 86,104.3 | 89,584.1 | 93,204.5 | 96,971.2 |
| WACC, % | 5.47 | 5.52 | 5.39 | 5.42 | 5.31 | 5.42 | 5.42 | 5.42 | 5.42 | 5.42 |
| PV UFCF | ||||||||||
| SUM PV UFCF | 366,768.9 | |||||||||
| Long Term Growth Rate, % | 2.00 | |||||||||
| Free cash flow (T + 1) | 98,911 | |||||||||
| Terminal Value | 2,890,910 | |||||||||
| Present Terminal Value | 2,220,189 | |||||||||
| Enterprise Value | 2,586,958 | |||||||||
| Net Debt | -301,393 | |||||||||
| Equity Value | 2,888,351 | |||||||||
| Diluted Shares Outstanding, MM | 302 | |||||||||
| Equity Value Per Share | 9,568.19 |
What You Will Receive
- Comprehensive Toppan Inc. Financial Data: Pre-loaded with Toppan's historical and projected figures for accurate evaluations.
- Customizable Template: Easily adjust critical inputs such as revenue growth, WACC, and EBITDA percentage.
- Instant Calculations: Watch Toppan's intrinsic value refresh automatically as you modify the data.
- Expert Valuation Tool: Tailored for investors, analysts, and consultants looking for reliable DCF results.
- Intuitive Layout: Clear format and straightforward instructions suitable for all skill levels.
Key Features
- Advanced DCF Calculator: Comprehensive unlevered and levered DCF valuation models tailored for Toppan Inc. (7911T).
- WACC Calculator: Pre-configured Weighted Average Cost of Capital sheet with adjustable parameters.
- Customizable Forecast Assumptions: Adjust growth rates, capital expenditures, and discount rates as needed.
- Integrated Financial Ratios: Evaluate profitability, leverage, and efficiency ratios specifically for Toppan Inc. (7911T).
- Dashboard and Charts: Visual representations of essential valuation metrics for straightforward analysis.
How It Works
- Step 1: Download the Excel file.
- Step 2: Review the pre-filled Toppan Inc. (7911T) data, including historical and projected figures.
- Step 3: Modify the key assumptions in the yellow cells based on your insights.
- Step 4: Observe the automatic recalculations for Toppan Inc.'s intrinsic value.
- Step 5: Utilize the results to inform your investment choices or reporting.
Why Opt for Toppan's DCF Calculator?
- Precision: Leverages real Toppan financial data for reliable results.
- Versatility: Crafted to allow users to easily adjust and experiment with inputs.
- Efficiency: Avoid the complexity of constructing a DCF model from the ground up.
- Expert-Quality: Designed with the accuracy and practicality expected by CFOs.
- Intuitive: Simple interface suitable for users with varying levels of financial modeling expertise.
Who Can Benefit from Toppan Inc. (7911T)?
- Investors: Make informed decisions with a reliable valuation tool designed for professionals.
- Financial Analysts: Enhance efficiency with a customizable DCF model that’s ready to use.
- Consultants: Seamlessly modify the template for client presentations or analysis reports.
- Finance Enthusiasts: Expand your knowledge of valuation methods through practical, real-life scenarios.
- Educators and Students: Utilize it as a hands-on resource for finance courses and studies.
Contents of the Template
- Pre-Filled DCF Model: Toppan Inc.’s financial data preloaded for immediate analysis.
- WACC Calculator: Comprehensive calculations for Weighted Average Cost of Capital.
- Financial Ratios: Assess Toppan Inc.'s profitability, leverage, and operational efficiency.
- Editable Inputs: Modify assumptions such as growth rates, profit margins, and CAPEX to tailor your scenarios.
- Financial Statements: Access annual and quarterly reports to facilitate in-depth evaluation.
- Interactive Dashboard: Quickly visualize essential valuation metrics and outcomes.
Disclaimer
All information, articles, and product details provided on this website are for general informational and educational purposes only. We do not claim any ownership over, nor do we intend to infringe upon, any trademarks, copyrights, logos, brand names, or other intellectual property mentioned or depicted on this site. Such intellectual property remains the property of its respective owners, and any references here are made solely for identification or informational purposes, without implying any affiliation, endorsement, or partnership.
We make no representations or warranties, express or implied, regarding the accuracy, completeness, or suitability of any content or products presented. Nothing on this website should be construed as legal, tax, investment, financial, medical, or other professional advice. In addition, no part of this site—including articles or product references—constitutes a solicitation, recommendation, endorsement, advertisement, or offer to buy or sell any securities, franchises, or other financial instruments, particularly in jurisdictions where such activity would be unlawful.
All content is of a general nature and may not address the specific circumstances of any individual or entity. It is not a substitute for professional advice or services. Any actions you take based on the information provided here are strictly at your own risk. You accept full responsibility for any decisions or outcomes arising from your use of this website and agree to release us from any liability in connection with your use of, or reliance upon, the content or products found herein.