
|
ASICS Corporation (7936.T) Évaluation DCF |
Entièrement Modifiable: Adapté À Vos Besoins Dans Excel Ou Sheets
Conception Professionnelle: Modèles Fiables Et Conformes Aux Normes Du Secteur
Pré-Construits Pour Une Utilisation Rapide Et Efficace
Compatible MAC/PC, entièrement débloqué
Aucune Expertise N'Est Requise; Facile À Suivre
ASICS Corporation (7936.T) Bundle
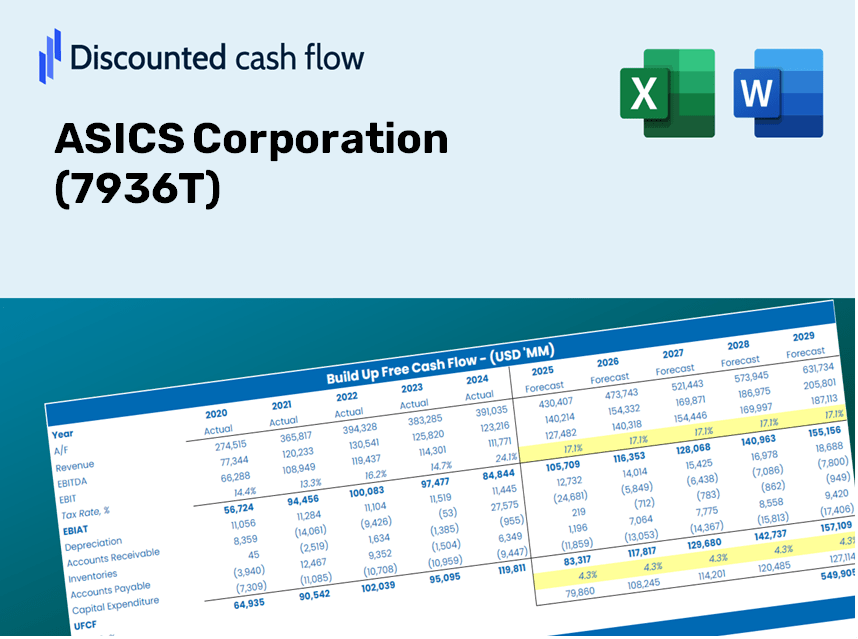
Découvrez la vraie valeur d'Asics Corporation (7936T) avec notre calculatrice DCF de qualité professionnelle! Ajustez les hypothèses clés, explorez divers scénarios et évaluez comment les changements influencent la valorisation ASICS Corporation (7936T) - le tout dans un seul modèle Excel.
What You Will Receive
- Customizable Excel Template: A fully adjustable Excel-based DCF Calculator featuring pre-populated real ASICS Corporation (7936T) financials.
- Actual Data: Historical performance data and future projections (as highlighted in the yellow cells).
- Forecast Flexibility: Modify forecast parameters such as revenue growth, EBITDA percentage, and WACC.
- Instant Calculations: Quickly observe how your inputs affect ASICS Corporation (7936T)’s valuation.
- Professional Resource: Designed for investors, CFOs, consultants, and financial analysts.
- Intuitive Interface: Organized for clarity and ease, complete with step-by-step guidance.
Key Features
- Authentic ASICS Data: Powered by ASICS Corporation’s historical performance metrics and future projections.
- Completely Customizable Parameters: Tailor revenue growth, profit margins, WACC, tax rates, and capital expenditures to fit your analysis.
- Adaptive Valuation Framework: Automatic recalculations for Net Present Value (NPV) and intrinsic value based on your customized inputs.
- Scenario Analysis: Develop various forecasting scenarios to explore distinct valuation possibilities.
- Intuitive Interface: Designed for ease of use, catering to both seasoned professionals and newcomers.
How It Functions
- Step 1: Download the Excel file.
- Step 2: Review the pre-filled ASICS data (historical and projected).
- Step 3: Modify key assumptions (highlighted in yellow) based on your insights.
- Step 4: Observe the automatic recalculations for ASICS' intrinsic value.
- Step 5: Utilize the results for investment decisions or reporting purposes.
Why Choose the ASICS Calculator?
- Precision: Genuine ASICS financial data ensures reliable results.
- Adaptability: Crafted to allow users to easily alter and experiment with inputs.
- Efficiency: Eliminate the complexities of creating a DCF model from the ground up.
- Executive-Quality: Designed with the accuracy and functionality expected at the CFO level.
- Accessible: Intuitive interface, suitable for users without extensive financial modeling skills.
Who Can Benefit from This Product?
- Individual Investors: Make well-informed decisions about purchasing or selling ASICS Corporation (7936T) stock.
- Financial Analysts: Optimize valuation workflows with comprehensive financial models readily available.
- Consultants: Provide clients with precise and timely valuation insights.
- Business Owners: Gain insights on how major companies like ASICS Corporation (7936T) are valued to refine your own strategies.
- Finance Students: Master valuation techniques utilizing real-world data and case studies.
Contents of the ASICS Corporation Template
- In-Depth DCF Model: Customizable template featuring comprehensive valuation analytics.
- Actual Financial Data: ASICS Corporation’s historical and projected financials pre-loaded for your analysis.
- Adjustable Inputs: Modify WACC, growth rates, and tax assumptions to explore various scenarios.
- Financial Statements: Complete annual and quarterly disclosures for enhanced insights.
- Essential Ratios: Integrated analysis covering profitability, efficiency, and leverage metrics.
- Interactive Dashboard with Visual Outputs: Graphs and tables presenting clear, actionable insights.
Disclaimer
All information, articles, and product details provided on this website are for general informational and educational purposes only. We do not claim any ownership over, nor do we intend to infringe upon, any trademarks, copyrights, logos, brand names, or other intellectual property mentioned or depicted on this site. Such intellectual property remains the property of its respective owners, and any references here are made solely for identification or informational purposes, without implying any affiliation, endorsement, or partnership.
We make no representations or warranties, express or implied, regarding the accuracy, completeness, or suitability of any content or products presented. Nothing on this website should be construed as legal, tax, investment, financial, medical, or other professional advice. In addition, no part of this site—including articles or product references—constitutes a solicitation, recommendation, endorsement, advertisement, or offer to buy or sell any securities, franchises, or other financial instruments, particularly in jurisdictions where such activity would be unlawful.
All content is of a general nature and may not address the specific circumstances of any individual or entity. It is not a substitute for professional advice or services. Any actions you take based on the information provided here are strictly at your own risk. You accept full responsibility for any decisions or outcomes arising from your use of this website and agree to release us from any liability in connection with your use of, or reliance upon, the content or products found herein.