
|
Liintec Corporation (7966.T) Valeure DCF |
Entièrement Modifiable: Adapté À Vos Besoins Dans Excel Ou Sheets
Conception Professionnelle: Modèles Fiables Et Conformes Aux Normes Du Secteur
Pré-Construits Pour Une Utilisation Rapide Et Efficace
Compatible MAC/PC, entièrement débloqué
Aucune Expertise N'Est Requise; Facile À Suivre
LINTEC Corporation (7966.T) Bundle
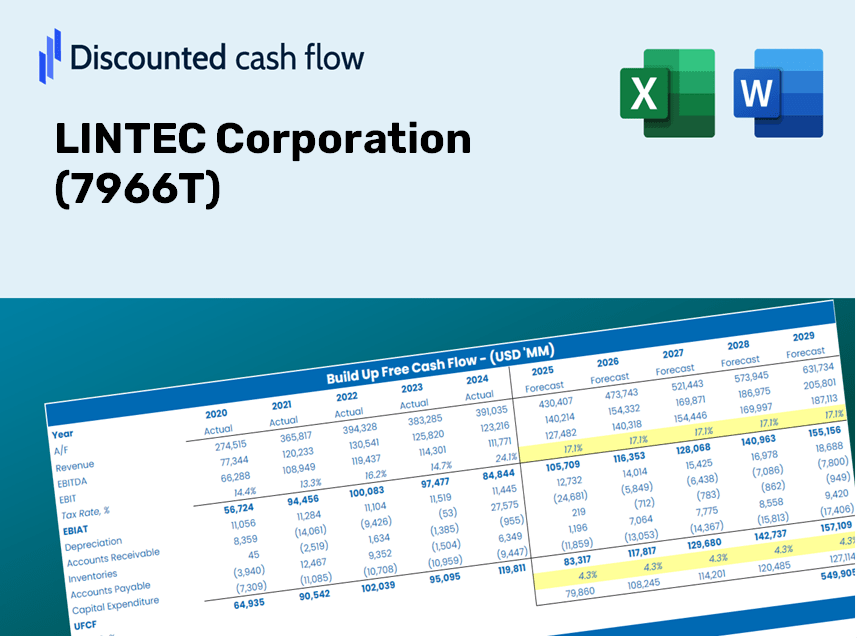
Découvrez le véritable potentiel de Liintec Corporation (7966T) avec notre calculatrice avancée DCF! Ajustez les hypothèses clés, explorez divers scénarios et évaluez comment les différents changements affectent l'évaluation (7966T) de Liintec Corporation - le tout dans un modèle Excel pratique.
Discounted Cash Flow (DCF) - (USD MM)
| Year | AY1 2021 |
AY2 2022 |
AY3 2023 |
AY4 2024 |
AY5 2025 |
FY1 2026 |
FY2 2027 |
FY3 2028 |
FY4 2029 |
FY5 2030 |
|---|---|---|---|---|---|---|---|---|---|---|
| Revenue | 235,902.0 | 256,836.0 | 284,603.0 | 276,321.0 | 315,978.0 | 340,566.6 | 367,068.6 | 395,632.9 | 426,420.1 | 459,603.0 |
| Revenue Growth, % | 0 | 8.87 | 10.81 | -2.91 | 14.35 | 7.78 | 7.78 | 7.78 | 7.78 | 7.78 |
| EBITDA | 29,502.0 | 36,435.0 | 30,868.0 | 25,753.0 | 36,418.0 | 39,767.0 | 42,861.5 | 46,196.9 | 49,791.8 | 53,666.5 |
| EBITDA, % | 12.51 | 14.19 | 10.85 | 9.32 | 11.53 | 11.68 | 11.68 | 11.68 | 11.68 | 11.68 |
| Depreciation | 12,471.0 | 13,095.0 | 14,890.0 | 15,902.0 | 17,363.0 | 18,299.9 | 19,724.0 | 21,258.8 | 22,913.1 | 24,696.2 |
| Depreciation, % | 5.29 | 5.1 | 5.23 | 5.75 | 5.5 | 5.37 | 5.37 | 5.37 | 5.37 | 5.37 |
| EBIT | 17,031.0 | 23,340.0 | 15,978.0 | 9,851.0 | 19,055.0 | 21,467.1 | 23,137.6 | 24,938.1 | 26,878.7 | 28,970.3 |
| EBIT, % | 7.22 | 9.09 | 5.61 | 3.57 | 6.03 | 6.3 | 6.3 | 6.3 | 6.3 | 6.3 |
| Total Cash | 61,823.0 | 55,416.0 | 38,032.0 | 55,490.0 | 55,511.0 | 67,293.5 | 72,530.1 | 78,174.2 | 84,257.5 | 90,814.2 |
| Total Cash, percent | .0 | .0 | .0 | .0 | .0 | .0 | .0 | .0 | .0 | .0 |
| Account Receivables | 64,591.0 | 62,289.0 | 58,648.0 | 64,582.0 | 64,535.0 | 79,035.8 | 85,186.2 | 91,815.2 | 98,960.0 | 106,660.8 |
| Account Receivables, % | 27.38 | 24.25 | 20.61 | 23.37 | 20.42 | 23.21 | 23.21 | 23.21 | 23.21 | 23.21 |
| Inventories | 38,432.0 | 52,536.0 | 67,250.0 | 59,548.0 | 64,054.0 | 69,610.4 | 75,027.3 | 80,865.8 | 87,158.5 | 93,941.0 |
| Inventories, % | 16.29 | 20.46 | 23.63 | 21.55 | 20.27 | 20.44 | 20.44 | 20.44 | 20.44 | 20.44 |
| Accounts Payable | 44,835.0 | 40,072.0 | 36,980.0 | 45,705.0 | 40,350.0 | 52,387.3 | 56,463.9 | 60,857.8 | 65,593.6 | 70,697.9 |
| Accounts Payable, % | 19.01 | 15.6 | 12.99 | 16.54 | 12.77 | 15.38 | 15.38 | 15.38 | 15.38 | 15.38 |
| Capital Expenditure | -9,448.0 | -8,732.0 | -13,728.0 | -14,928.0 | -23,761.0 | -17,131.0 | -18,464.1 | -19,900.9 | -21,449.5 | -23,118.7 |
| Capital Expenditure, % | -4.01 | -3.4 | -4.82 | -5.4 | -7.52 | -5.03 | -5.03 | -5.03 | -5.03 | -5.03 |
| Tax Rate, % | 22.81 | 22.81 | 22.81 | 22.81 | 22.81 | 22.81 | 22.81 | 22.81 | 22.81 | 22.81 |
| EBITAT | 11,678.5 | 16,719.8 | 11,596.2 | 5,464.3 | 14,709.1 | 14,831.5 | 15,985.6 | 17,229.6 | 18,570.3 | 20,015.4 |
| Depreciation | ||||||||||
| Changes in Account Receivables | ||||||||||
| Changes in Inventories | ||||||||||
| Changes in Accounts Payable | ||||||||||
| Capital Expenditure | ||||||||||
| UFCF | -43,486.5 | 4,517.8 | -1,406.8 | 16,931.3 | -1,502.9 | 7,980.4 | 9,754.9 | 10,514.0 | 11,332.2 | 12,214.0 |
| WACC, % | 4.6 | 4.61 | 4.61 | 4.59 | 4.62 | 4.61 | 4.61 | 4.61 | 4.61 | 4.61 |
| PV UFCF | ||||||||||
| SUM PV UFCF | 44,945.7 | |||||||||
| Long Term Growth Rate, % | 2.00 | |||||||||
| Free cash flow (T + 1) | 12,458 | |||||||||
| Terminal Value | 478,168 | |||||||||
| Present Terminal Value | 381,777 | |||||||||
| Enterprise Value | 426,723 | |||||||||
| Net Debt | -45,166 | |||||||||
| Equity Value | 471,889 | |||||||||
| Diluted Shares Outstanding, MM | 68 | |||||||||
| Equity Value Per Share | 6,906.94 |
What You Will Receive
- Genuine LINTEC Financials: Access to both historical and projected data for precise valuation.
- Customizable Inputs: Adjust WACC, tax rates, revenue growth, and capital expenditures as needed.
- Instant Calculations: Automatically computes intrinsic value and NPV in real-time.
- Scenario Analysis: Explore various scenarios to assess LINTEC's future performance.
- User-Friendly Interface: Designed for professionals while remaining approachable for newcomers.
Key Features of LINTEC Corporation (7966T)
- Customizable Forecast Inputs: Adjust key factors such as revenue growth, EBITDA margins, and capital expenses.
- Instant DCF Valuation: Automatically computes intrinsic value, NPV, and other financial metrics with ease.
- High-Precision Accuracy: Leverages LINTEC's actual financial data for dependable valuation results.
- Effortless Scenario Analysis: Easily evaluate various scenarios and compare results side by side.
- Efficiency Booster: Streamlines the valuation process by removing the need for complex model creation.
How It Works
- 1. Access the Template: Download and open the Excel file containing LINTEC Corporation's (7966T) preloaded data.
- 2. Adjust Assumptions: Modify key inputs such as growth rates, WACC, and capital expenditures to fit your analysis.
- 3. See Instant Results: The DCF model automatically calculates the intrinsic value and NPV based on your inputs.
- 4. Explore Scenarios: Evaluate various forecasts to understand different valuation outcomes.
- 5. Present with Assurance: Share professional valuation insights to bolster your decision-making process.
Why Opt for the LINTEC Corporation (7966T) Calculator?
- Time-Saving: Skip the hassle of building a DCF model from the ground up – it's ready for immediate use.
- Enhanced Accuracy: Dependable financial data and formulas significantly minimize valuation errors.
- Completely Customizable: Adjust the model to align with your specific assumptions and forecasts.
- User-Friendly: Intuitive charts and outputs simplify the analysis of results.
- Endorsed by Professionals: Crafted for experts prioritizing both precision and functionality.
Who Should Utilize LINTEC Corporation (7966T)?
- Professional Investors: Create comprehensive and trustworthy valuation models for portfolio evaluation.
- Corporate Finance Teams: Assess valuation scenarios to inform internal strategic decisions.
- Consultants and Advisors: Offer clients precise valuation insights regarding LINTEC Corporation (7966T).
- Students and Educators: Leverage real-world data to enhance financial modeling skills and instruction.
- Tech Enthusiasts: Gain insight into market valuation processes for tech companies like LINTEC Corporation (7966T).
Overview of the Template Contents
- Pre-Filled Data: Includes LINTEC Corporation's historical financials and forecasts.
- Discounted Cash Flow Model: An editable DCF valuation model featuring automatic calculations.
- Weighted Average Cost of Capital (WACC): A dedicated sheet for computing WACC with custom inputs.
- Key Financial Ratios: Evaluate LINTEC Corporation's profitability, efficiency, and leverage.
- Customizable Inputs: Easily modify revenue growth, margins, and tax rates.
- Clear Dashboard: Visual representations and tables summarizing essential valuation results.
Disclaimer
All information, articles, and product details provided on this website are for general informational and educational purposes only. We do not claim any ownership over, nor do we intend to infringe upon, any trademarks, copyrights, logos, brand names, or other intellectual property mentioned or depicted on this site. Such intellectual property remains the property of its respective owners, and any references here are made solely for identification or informational purposes, without implying any affiliation, endorsement, or partnership.
We make no representations or warranties, express or implied, regarding the accuracy, completeness, or suitability of any content or products presented. Nothing on this website should be construed as legal, tax, investment, financial, medical, or other professional advice. In addition, no part of this site—including articles or product references—constitutes a solicitation, recommendation, endorsement, advertisement, or offer to buy or sell any securities, franchises, or other financial instruments, particularly in jurisdictions where such activity would be unlawful.
All content is of a general nature and may not address the specific circumstances of any individual or entity. It is not a substitute for professional advice or services. Any actions you take based on the information provided here are strictly at your own risk. You accept full responsibility for any decisions or outcomes arising from your use of this website and agree to release us from any liability in connection with your use of, or reliance upon, the content or products found herein.