
|
Mitsui & Co., Ltd. (8031.T) Évaluation DCF |
Entièrement Modifiable: Adapté À Vos Besoins Dans Excel Ou Sheets
Conception Professionnelle: Modèles Fiables Et Conformes Aux Normes Du Secteur
Pré-Construits Pour Une Utilisation Rapide Et Efficace
Compatible MAC/PC, entièrement débloqué
Aucune Expertise N'Est Requise; Facile À Suivre
Mitsui & Co., Ltd. (8031.T) Bundle
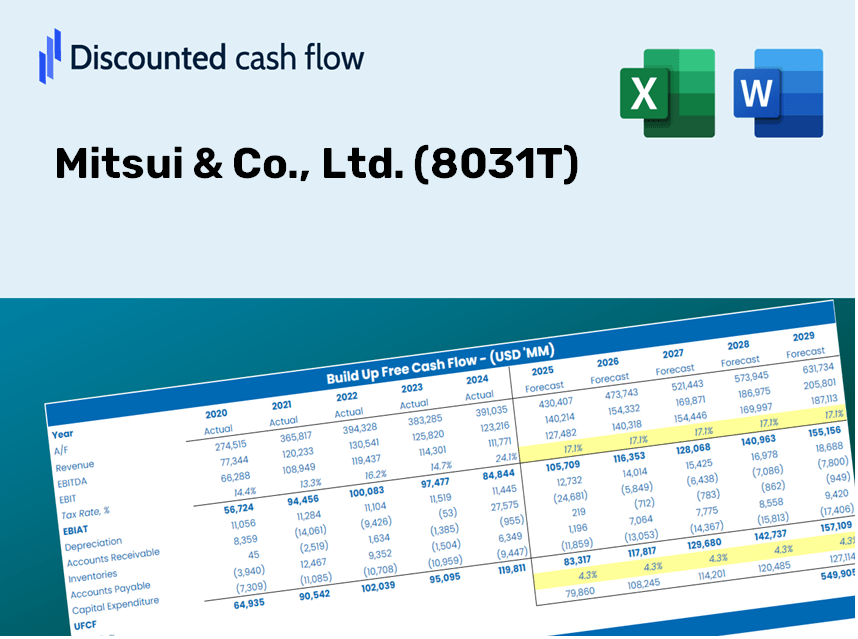
Simplifier Mitsui & Évaluation de Co., Ltd. (8031T) avec cette calculatrice DCF personnalisable! Avec de vrai Mitsui & Co., Ltd. (8031T) Financials and Adjustable Forecast Intarts, vous pouvez tester des scénarios et découvrir Mitsui & Co., Ltd. (8031T) juste valeur en minutes.
Discounted Cash Flow (DCF) - (USD MM)
| Year | AY1 2021 |
AY2 2022 |
AY3 2023 |
AY4 2024 |
AY5 2025 |
FY1 2026 |
FY2 2027 |
FY3 2028 |
FY4 2029 |
FY5 2030 |
|---|---|---|---|---|---|---|---|---|---|---|
| Revenue | 8,010,235.0 | 11,757,559.0 | 14,306,402.0 | 13,324,942.0 | 14,662,620.0 | 17,288,645.8 | 20,384,984.0 | 24,035,865.8 | 28,340,608.3 | 33,416,315.7 |
| Revenue Growth, % | 0 | 46.78 | 21.68 | -6.86 | 10.04 | 17.91 | 17.91 | 17.91 | 17.91 | 17.91 |
| EBITDA | 553,178.0 | 1,079,361.0 | 1,231,221.0 | 1,278,244.0 | 1,654,993.0 | 1,575,761.3 | 1,857,974.8 | 2,190,731.9 | 2,583,084.6 | 3,045,706.3 |
| EBITDA, % | 6.91 | 9.18 | 8.61 | 9.59 | 11.29 | 9.11 | 9.11 | 9.11 | 9.11 | 9.11 |
| Depreciation | 279,632.0 | 300,799.0 | 276,985.0 | 303,573.0 | 313,730.0 | 428,871.2 | 505,680.5 | 596,246.2 | 703,031.9 | 828,942.5 |
| Depreciation, % | 3.49 | 2.56 | 1.94 | 2.28 | 2.14 | 2.48 | 2.48 | 2.48 | 2.48 | 2.48 |
| EBIT | 273,546.0 | 778,562.0 | 954,236.0 | 974,671.0 | 1,341,263.0 | 1,146,890.2 | 1,352,294.3 | 1,594,485.7 | 1,880,052.7 | 2,216,763.8 |
| EBIT, % | 3.41 | 6.62 | 6.67 | 7.31 | 9.15 | 6.63 | 6.63 | 6.63 | 6.63 | 6.63 |
| Total Cash | 1,101,653.0 | 1,170,323.0 | 1,396,822.0 | 902,723.0 | 1,916,465.0 | 1,843,508.1 | 2,173,674.2 | 2,562,971.9 | 3,021,991.6 | 3,563,220.1 |
| Total Cash, percent | .0 | .0 | .0 | .0 | .0 | .0 | .0 | .0 | .0 | .0 |
| Account Receivables | 1,914,674.0 | 2,431,099.0 | 2,353,323.0 | 2,589,563.0 | 2,403,901.0 | 3,349,083.8 | 3,948,893.4 | 4,656,126.9 | 5,490,023.5 | 6,473,268.2 |
| Account Receivables, % | 23.9 | 20.68 | 16.45 | 19.43 | 16.39 | 19.37 | 19.37 | 19.37 | 19.37 | 19.37 |
| Inventories | 615,155.0 | 949,663.0 | 940,543.0 | 965,721.0 | 960,459.0 | 1,249,235.9 | 1,472,969.8 | 1,736,773.7 | 2,047,824.1 | 2,414,582.5 |
| Inventories, % | 7.68 | 8.08 | 6.57 | 7.25 | 6.55 | 7.23 | 7.23 | 7.23 | 7.23 | 7.23 |
| Accounts Payable | 1,134,874.0 | 1,523,588.0 | 1,287,852.0 | 1,647,029.0 | 1,675,665.0 | 2,071,758.4 | 2,442,803.4 | 2,880,301.2 | 3,396,153.5 | 4,004,393.1 |
| Accounts Payable, % | 14.17 | 12.96 | 9 | 12.36 | 11.43 | 11.98 | 11.98 | 11.98 | 11.98 | 11.98 |
| Capital Expenditure | -215,690.0 | -185,525.0 | -228,065.0 | -294,771.0 | -346,147.0 | -360,906.2 | -425,543.3 | -501,756.7 | -591,619.7 | -697,576.7 |
| Capital Expenditure, % | -2.69 | -1.58 | -1.59 | -2.21 | -2.36 | -2.09 | -2.09 | -2.09 | -2.09 | -2.09 |
| Tax Rate, % | 20.69 | 20.69 | 20.69 | 20.69 | 20.69 | 20.69 | 20.69 | 20.69 | 20.69 | 20.69 |
| EBITAT | 203,826.7 | 611,575.8 | 773,232.8 | 796,028.5 | 1,063,744.2 | 906,219.9 | 1,068,520.8 | 1,259,889.3 | 1,485,531.2 | 1,751,584.8 |
| Depreciation | ||||||||||
| Changes in Account Receivables | ||||||||||
| Changes in Inventories | ||||||||||
| Changes in Accounts Payable | ||||||||||
| Capital Expenditure | ||||||||||
| UFCF | -1,127,186.3 | 264,630.8 | 673,312.8 | 902,589.5 | 1,250,887.2 | 136,318.6 | 696,159.4 | 820,839.2 | 967,848.7 | 1,141,187.1 |
| WACC, % | 5.2 | 5.25 | 5.28 | 5.29 | 5.26 | 5.26 | 5.26 | 5.26 | 5.26 | 5.26 |
| PV UFCF | ||||||||||
| SUM PV UFCF | 3,133,450.7 | |||||||||
| Long Term Growth Rate, % | 1.00 | |||||||||
| Free cash flow (T + 1) | 1,152,599 | |||||||||
| Terminal Value | 27,069,465 | |||||||||
| Present Terminal Value | 20,951,038 | |||||||||
| Enterprise Value | 24,084,489 | |||||||||
| Net Debt | 3,863,904 | |||||||||
| Equity Value | 20,220,585 | |||||||||
| Diluted Shares Outstanding, MM | 2,938 | |||||||||
| Equity Value Per Share | 6,883.32 |
What You Will Receive
- Authentic 8031T Financial Data: Access to historical and projected figures for precise valuation.
- Customizable Parameters: Adjust WACC, tax rates, revenue growth, and capital investments.
- Instant Calculations: Dynamic computation of intrinsic value and NPV.
- Scenario Simulation: Evaluate various scenarios to assess Mitsui & Co., Ltd.'s future prospects.
- User-Friendly Interface: Designed for professionals, yet simple enough for newcomers.
Key Features
- 🔍 Real-Life Mitsui Financials: Pre-filled historical and projected data for Mitsui & Co., Ltd. (8031T).
- ✏️ Fully Customizable Inputs: Modify all essential parameters (yellow cells) such as WACC, growth %, and tax rates.
- 📊 Professional DCF Valuation: Integrated formulas calculate Mitsui’s intrinsic value through the Discounted Cash Flow method.
- ⚡ Instant Results: Get immediate visualization of Mitsui’s valuation after making adjustments.
- Scenario Analysis: Evaluate and contrast outcomes for different financial assumptions side-by-side.
How It Works
- Download: Obtain the pre-configured Excel file containing Mitsui & Co., Ltd.'s (8031T) financial data.
- Customize: Tailor your forecasts, including revenue growth, EBITDA %, and WACC.
- Update Automatically: The intrinsic value and NPV calculations refresh in real-time.
- Test Scenarios: Generate various projections and instantly compare the results.
- Make Decisions: Leverage the valuation outcomes to inform your investment strategy.
Why Select This Calculator for Mitsui & Co., Ltd. (8031T)?
- All-in-One Tool: Features DCF, WACC, and financial ratio analyses seamlessly integrated.
- Flexible Inputs: Modify the yellow-highlighted fields to explore different scenarios.
- In-Depth Analysis: Automatically computes Mitsui's intrinsic value and Net Present Value.
- Built-in Data: Offers historical and projected data for reliable analysis.
- Expert-Level Tool: Perfect for financial analysts, investors, and business strategists.
Who Can Benefit from Mitsui & Co., Ltd. (8031T)?
- Investors: Gain confidence in your investment choices with our expert valuation tool.
- Financial Analysts: Enhance your efficiency with a customizable DCF model at your fingertips.
- Consultants: Effortlessly modify the template for impactful client presentations or reports.
- Finance Enthusiasts: Expand your knowledge of valuation methods with practical, real-world examples.
- Educators and Students: Utilize it as an interactive resource for finance-related educational programs.
What the Template Includes
- Pre-Filled DCF Model: Mitsui & Co., Ltd. (8031T)’s financial data readily available for instant analysis.
- WACC Calculator: Comprehensive calculations for the Weighted Average Cost of Capital.
- Financial Ratios: Assess Mitsui & Co., Ltd. (8031T)’s profitability, leverage, and operational efficiency.
- Editable Inputs: Adjust key assumptions such as growth rates, margins, and CAPEX to suit your specific scenarios.
- Financial Statements: Access to annual and quarterly reports for thorough analysis.
- Interactive Dashboard: Effortlessly visualize essential valuation metrics and outcomes.
Disclaimer
All information, articles, and product details provided on this website are for general informational and educational purposes only. We do not claim any ownership over, nor do we intend to infringe upon, any trademarks, copyrights, logos, brand names, or other intellectual property mentioned or depicted on this site. Such intellectual property remains the property of its respective owners, and any references here are made solely for identification or informational purposes, without implying any affiliation, endorsement, or partnership.
We make no representations or warranties, express or implied, regarding the accuracy, completeness, or suitability of any content or products presented. Nothing on this website should be construed as legal, tax, investment, financial, medical, or other professional advice. In addition, no part of this site—including articles or product references—constitutes a solicitation, recommendation, endorsement, advertisement, or offer to buy or sell any securities, franchises, or other financial instruments, particularly in jurisdictions where such activity would be unlawful.
All content is of a general nature and may not address the specific circumstances of any individual or entity. It is not a substitute for professional advice or services. Any actions you take based on the information provided here are strictly at your own risk. You accept full responsibility for any decisions or outcomes arising from your use of this website and agree to release us from any liability in connection with your use of, or reliance upon, the content or products found herein.