
|
Sumitomo Corporation (8053.T) Évaluation DCF |
Entièrement Modifiable: Adapté À Vos Besoins Dans Excel Ou Sheets
Conception Professionnelle: Modèles Fiables Et Conformes Aux Normes Du Secteur
Pré-Construits Pour Une Utilisation Rapide Et Efficace
Compatible MAC/PC, entièrement débloqué
Aucune Expertise N'Est Requise; Facile À Suivre
Sumitomo Corporation (8053.T) Bundle
Évaluez les perspectives financières de Sumitomo Corporation (8053T) avec une précision experte! Ce calculatrice DCF (8053T) fournit des données financières pré-remplies et une flexibilité complète pour modifier la croissance des revenus, le WACC, les marges et d'autres hypothèses critiques pour s'aligner sur vos projections.
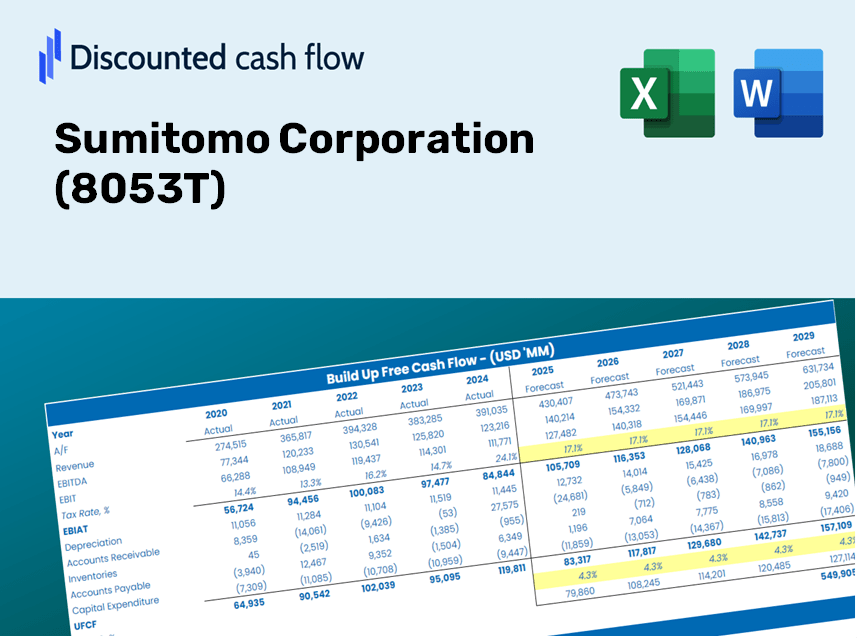
Discounted Cash Flow (DCF) - (USD MM)
| Year | AY1 2021 |
AY2 2022 |
AY3 2023 |
AY4 2024 |
AY5 2025 |
FY1 2026 |
FY2 2027 |
FY3 2028 |
FY4 2029 |
FY5 2030 |
|---|---|---|---|---|---|---|---|---|---|---|
| Revenue | 4,645,059.0 | 5,495,015.0 | 6,817,872.0 | 6,910,302.0 | 7,292,084.0 | 8,189,964.8 | 9,198,402.5 | 10,331,010.0 | 11,603,076.5 | 13,031,773.7 |
| Revenue Growth, % | 0 | 18.3 | 24.07 | 1.36 | 5.52 | 12.31 | 12.31 | 12.31 | 12.31 | 12.31 |
| EBITDA | 158,576.0 | 624,653.0 | 723,038.0 | 654,245.0 | 736,022.0 | 736,239.3 | 826,893.1 | 928,709.2 | 1,043,062.0 | 1,171,495.2 |
| EBITDA, % | 3.41 | 11.37 | 10.61 | 9.47 | 10.09 | 8.99 | 8.99 | 8.99 | 8.99 | 8.99 |
| Depreciation | 170,906.0 | 170,363.0 | 183,749.0 | 200,172.0 | 219,467.0 | 251,941.6 | 282,963.4 | 317,804.9 | 356,936.5 | 400,886.4 |
| Depreciation, % | 3.68 | 3.1 | 2.7 | 2.9 | 3.01 | 3.08 | 3.08 | 3.08 | 3.08 | 3.08 |
| EBIT | -12,330.0 | 454,290.0 | 539,289.0 | 454,073.0 | 516,555.0 | 484,297.8 | 543,929.8 | 610,904.3 | 686,125.5 | 770,608.8 |
| EBIT, % | -0.26544 | 8.27 | 7.91 | 6.57 | 7.08 | 5.91 | 5.91 | 5.91 | 5.91 | 5.91 |
| Total Cash | 613,385.0 | 749,979.0 | 669,383.0 | 691,195.0 | 589,905.0 | 897,023.4 | 1,007,474.7 | 1,131,526.0 | 1,270,851.8 | 1,427,332.9 |
| Total Cash, percent | .0 | .0 | .0 | .0 | .0 | .0 | .0 | .0 | .0 | .0 |
| Account Receivables | 1,492,433.0 | 1,922,401.0 | 2,105,364.0 | 2,284,718.0 | 2,051,737.0 | 2,607,570.0 | 2,928,642.4 | 3,289,248.8 | 3,694,256.9 | 4,149,134.1 |
| Account Receivables, % | 32.13 | 34.98 | 30.88 | 33.06 | 28.14 | 31.84 | 31.84 | 31.84 | 31.84 | 31.84 |
| Inventories | 793,279.0 | 1,058,003.0 | 1,390,559.0 | 1,486,770.0 | 1,653,842.0 | 1,653,108.4 | 1,856,657.1 | 2,085,269.0 | 2,342,030.0 | 2,630,406.3 |
| Inventories, % | 17.08 | 19.25 | 20.4 | 21.52 | 22.68 | 20.18 | 20.18 | 20.18 | 20.18 | 20.18 |
| Accounts Payable | 1,269,631.0 | 1,612,480.0 | 1,648,976.0 | 1,713,936.0 | 1,822,237.0 | 2,140,124.6 | 2,403,640.1 | 2,699,602.4 | 3,032,006.9 | 3,405,340.6 |
| Accounts Payable, % | 27.33 | 29.34 | 24.19 | 24.8 | 24.99 | 26.13 | 26.13 | 26.13 | 26.13 | 26.13 |
| Capital Expenditure | -66,342.0 | -69,716.0 | -70,295.0 | -93,380.0 | -102,799.0 | -106,289.9 | -119,377.4 | -134,076.5 | -150,585.4 | -169,127.2 |
| Capital Expenditure, % | -1.43 | -1.27 | -1.03 | -1.35 | -1.41 | -1.3 | -1.3 | -1.3 | -1.3 | -1.3 |
| Tax Rate, % | -34.22 | -34.22 | -34.22 | -34.22 | -34.22 | -34.22 | -34.22 | -34.22 | -34.22 | -34.22 |
| EBITAT | -20,032.0 | 357,025.0 | 421,616.7 | 332,480.5 | 693,335.8 | 416,487.9 | 467,770.4 | 525,367.4 | 590,056.4 | 662,710.6 |
| Depreciation | ||||||||||
| Changes in Account Receivables | ||||||||||
| Changes in Inventories | ||||||||||
| Changes in Accounts Payable | ||||||||||
| Capital Expenditure | ||||||||||
| UFCF | -931,549.0 | 105,829.0 | 56,047.7 | 228,667.5 | 984,213.8 | 324,927.8 | 370,250.7 | 415,840.0 | 467,042.7 | 524,550.1 |
| WACC, % | 5.12 | 4.79 | 4.78 | 4.7 | 5.12 | 4.9 | 4.9 | 4.9 | 4.9 | 4.9 |
| PV UFCF | ||||||||||
| SUM PV UFCF | 1,805,140.9 | |||||||||
| Long Term Growth Rate, % | 2.00 | |||||||||
| Free cash flow (T + 1) | 535,041 | |||||||||
| Terminal Value | 18,450,817 | |||||||||
| Present Terminal Value | 14,525,859 | |||||||||
| Enterprise Value | 16,331,000 | |||||||||
| Net Debt | 3,213,021 | |||||||||
| Equity Value | 13,117,979 | |||||||||
| Diluted Shares Outstanding, MM | 1,213 | |||||||||
| Equity Value Per Share | 10,817.35 |
What You Will Receive
- Adjustable Forecast Parameters: Easily modify assumptions (growth %, margins, WACC) to generate various scenarios.
- Comprehensive Data: Sumitomo Corporation’s financial information pre-loaded to facilitate your analysis.
- Instant DCF Calculations: The template automatically computes Net Present Value (NPV) and intrinsic value for you.
- Tailored and Professional: A well-designed Excel model that can be customized to fit your valuation requirements.
- Designed for Analysts and Investors: Perfect for testing forecasts, validating strategies, and optimizing your time.
Key Features
- Accurate Sumitomo Financials: Gain access to reliable historical data and future forecasts specific to Sumitomo Corporation (8053T).
- Customizable Projection Inputs: Modify highlighted cells for WACC, growth rates, and profit margins to tailor your financial model.
- Real-Time Calculations: Enjoy automatic recalculations for DCF, Net Present Value (NPV), and cash flow assessments.
- User-Friendly Dashboard: Interactive charts and summaries that facilitate a clear understanding of your valuation outcomes.
- Designed for All Skill Levels: An intuitive layout that serves both novice investors and seasoned professionals including CFOs and consultants.
How It Works
- Step 1: Download the Excel file.
- Step 2: Examine the pre-filled Sumitomo Corporation (8053T) data (historical and projected).
- Step 3: Modify the key assumptions (highlighted in yellow) based on your insights.
- Step 4: Observe the automatic recalculations reflecting Sumitomo Corporation’s intrinsic value.
- Step 5: Utilize the results for your investment strategies or reporting needs.
Why Select This Calculator for Sumitomo Corporation (8053T)?
- Precision: Authentic Sumitomo financials guarantee data reliability.
- Versatility: Crafted for users to effortlessly explore and adjust inputs.
- Efficiency: Eliminate the complexities of creating a DCF model from the ground up.
- Expert-Level: Designed with the precision and functionality expected by CFOs.
- Accessible: Intuitive design suitable for users without extensive financial modeling skills.
Who Should Benefit from This Product?
- Individual Investors: Make well-informed choices regarding the purchase or sale of Sumitomo Corporation (8053T) stock.
- Financial Analysts: Enhance valuation efforts with easy-to-use financial models tailored for Sumitomo Corporation (8053T).
- Consultants: Provide fast and accurate valuation insights related to Sumitomo Corporation (8053T) for your clients.
- Business Owners: Gain insights into how major companies like Sumitomo Corporation (8053T) are valued to inform your strategic decisions.
- Finance Students: Explore valuation methodologies using real-world examples and data from Sumitomo Corporation (8053T).
Contents of the Template
- Preloaded 8053T Data: Historical and projected financial metrics, including revenue, EBIT, and capital expenditures.
- DCF and WACC Models: Advanced spreadsheets for determining intrinsic value and Weighted Average Cost of Capital.
- Customizable Inputs: Cells highlighted in yellow for modifying revenue growth, tax rates, and discount rates.
- Financial Statements: Detailed annual and quarterly financial reports for in-depth analysis.
- Key Ratios: Profitability, leverage, and efficiency ratios for performance assessment.
- Dashboard and Charts: Visual representations of valuation results and underlying assumptions.
Disclaimer
All information, articles, and product details provided on this website are for general informational and educational purposes only. We do not claim any ownership over, nor do we intend to infringe upon, any trademarks, copyrights, logos, brand names, or other intellectual property mentioned or depicted on this site. Such intellectual property remains the property of its respective owners, and any references here are made solely for identification or informational purposes, without implying any affiliation, endorsement, or partnership.
We make no representations or warranties, express or implied, regarding the accuracy, completeness, or suitability of any content or products presented. Nothing on this website should be construed as legal, tax, investment, financial, medical, or other professional advice. In addition, no part of this site—including articles or product references—constitutes a solicitation, recommendation, endorsement, advertisement, or offer to buy or sell any securities, franchises, or other financial instruments, particularly in jurisdictions where such activity would be unlawful.
All content is of a general nature and may not address the specific circumstances of any individual or entity. It is not a substitute for professional advice or services. Any actions you take based on the information provided here are strictly at your own risk. You accept full responsibility for any decisions or outcomes arising from your use of this website and agree to release us from any liability in connection with your use of, or reliance upon, the content or products found herein.