
|
Iwatani Corporation (8088.T) Évaluation DCF |
Entièrement Modifiable: Adapté À Vos Besoins Dans Excel Ou Sheets
Conception Professionnelle: Modèles Fiables Et Conformes Aux Normes Du Secteur
Pré-Construits Pour Une Utilisation Rapide Et Efficace
Compatible MAC/PC, entièrement débloqué
Aucune Expertise N'Est Requise; Facile À Suivre
Iwatani Corporation (8088.T) Bundle
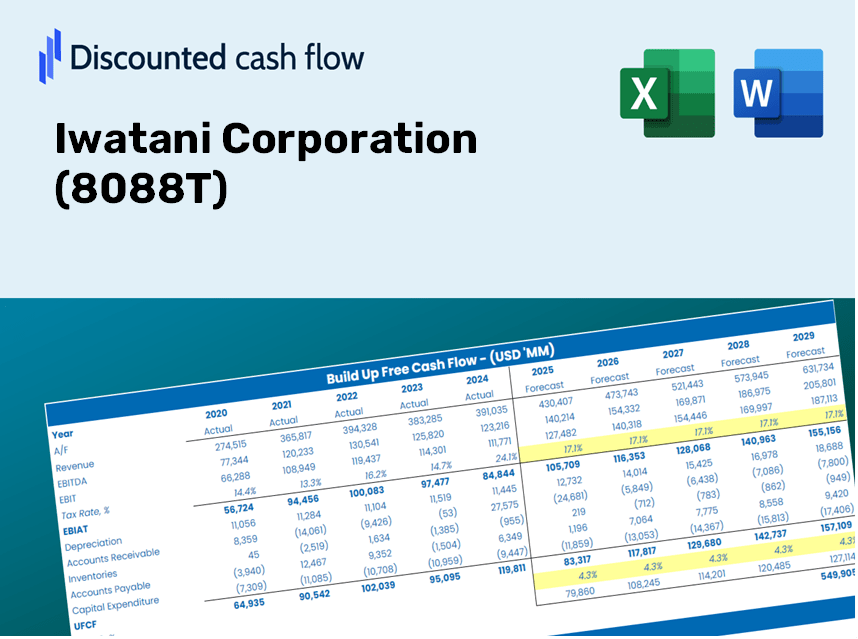
Que vous soyez un investisseur ou un analyste, ce (8088T) Calculator DCF est votre ressource essentielle pour une évaluation précise. Préchargé avec les données réelles d'Iwatani Corporation, vous pouvez ajuster les prévisions et observer les effets en temps réel.
Discounted Cash Flow (DCF) - (USD MM)
| Year | AY1 2021 |
AY2 2022 |
AY3 2023 |
AY4 2024 |
AY5 2025 |
FY1 2026 |
FY2 2027 |
FY3 2028 |
FY4 2029 |
FY5 2030 |
|---|---|---|---|---|---|---|---|---|---|---|
| Revenue | 562,223.0 | 690,392.0 | 906,261.0 | 847,888.0 | 883,011.0 | 997,285.3 | 1,126,348.4 | 1,272,114.1 | 1,436,743.9 | 1,622,679.3 |
| Revenue Growth, % | 0 | 22.8 | 31.27 | -6.44 | 4.14 | 12.94 | 12.94 | 12.94 | 12.94 | 12.94 |
| EBITDA | 58,265.0 | 70,654.0 | 76,070.0 | 79,953.0 | 96,777.0 | 98,493.1 | 111,239.5 | 125,635.5 | 141,894.6 | 160,257.8 |
| EBITDA, % | 10.36 | 10.23 | 8.39 | 9.43 | 10.96 | 9.88 | 9.88 | 9.88 | 9.88 | 9.88 |
| Depreciation | 23,210.0 | 23,878.0 | 27,557.0 | 29,317.0 | 31,178.0 | 35,136.6 | 39,683.8 | 44,819.5 | 50,619.7 | 57,170.7 |
| Depreciation, % | 4.13 | 3.46 | 3.04 | 3.46 | 3.53 | 3.52 | 3.52 | 3.52 | 3.52 | 3.52 |
| EBIT | 35,055.0 | 46,776.0 | 48,513.0 | 50,636.0 | 65,599.0 | 63,356.5 | 71,555.7 | 80,816.1 | 91,274.8 | 103,087.1 |
| EBIT, % | 6.24 | 6.78 | 5.35 | 5.97 | 7.43 | 6.35 | 6.35 | 6.35 | 6.35 | 6.35 |
| Total Cash | 38,782.0 | 29,975.0 | 33,730.0 | 33,937.0 | 27,759.0 | 44,095.6 | 49,802.2 | 56,247.3 | 63,526.5 | 71,747.8 |
| Total Cash, percent | .0 | .0 | .0 | .0 | .0 | .0 | .0 | .0 | .0 | .0 |
| Account Receivables | 123,960.0 | 151,724.0 | 174,115.0 | 172,656.0 | 162,256.0 | 203,397.4 | 229,719.9 | 259,449.0 | 293,025.4 | 330,947.1 |
| Account Receivables, % | 22.05 | 21.98 | 19.21 | 20.36 | 18.38 | 20.4 | 20.4 | 20.4 | 20.4 | 20.4 |
| Inventories | 38,588.0 | 56,137.0 | 69,610.0 | 74,463.0 | 84,552.0 | 81,843.7 | 92,435.5 | 104,397.9 | 117,908.5 | 133,167.6 |
| Inventories, % | 6.86 | 8.13 | 7.68 | 8.78 | 9.58 | 8.21 | 8.21 | 8.21 | 8.21 | 8.21 |
| Accounts Payable | 93,533.0 | 97,257.0 | 113,872.0 | 101,002.0 | 76,102.0 | 127,291.9 | 143,765.3 | 162,370.6 | 183,383.6 | 207,116.1 |
| Accounts Payable, % | 16.64 | 14.09 | 12.57 | 11.91 | 8.62 | 12.76 | 12.76 | 12.76 | 12.76 | 12.76 |
| Capital Expenditure | -30,265.0 | -28,444.0 | -30,912.0 | -40,940.0 | -54,636.0 | -47,730.0 | -53,906.9 | -60,883.2 | -68,762.4 | -77,661.3 |
| Capital Expenditure, % | -5.38 | -4.12 | -3.41 | -4.83 | -6.19 | -4.79 | -4.79 | -4.79 | -4.79 | -4.79 |
| Tax Rate, % | 35.63 | 35.63 | 35.63 | 35.63 | 35.63 | 35.63 | 35.63 | 35.63 | 35.63 | 35.63 |
| EBITAT | 23,228.8 | 30,507.3 | 32,827.9 | 34,763.4 | 42,225.2 | 42,090.8 | 47,538.0 | 53,690.1 | 60,638.3 | 68,485.8 |
| Depreciation | ||||||||||
| Changes in Account Receivables | ||||||||||
| Changes in Inventories | ||||||||||
| Changes in Accounts Payable | ||||||||||
| Capital Expenditure | ||||||||||
| UFCF | -52,841.2 | -15,647.7 | 10,223.9 | 6,876.4 | -5,821.8 | 42,254.2 | 12,873.9 | 14,540.0 | 16,421.7 | 18,546.9 |
| WACC, % | 4.37 | 4.35 | 4.39 | 4.4 | 4.34 | 4.37 | 4.37 | 4.37 | 4.37 | 4.37 |
| PV UFCF | ||||||||||
| SUM PV UFCF | 93,910.9 | |||||||||
| Long Term Growth Rate, % | 2.00 | |||||||||
| Free cash flow (T + 1) | 18,918 | |||||||||
| Terminal Value | 798,700 | |||||||||
| Present Terminal Value | 644,963 | |||||||||
| Enterprise Value | 738,874 | |||||||||
| Net Debt | 203,523 | |||||||||
| Equity Value | 535,351 | |||||||||
| Diluted Shares Outstanding, MM | 230 | |||||||||
| Equity Value Per Share | 2,326.28 |
What You Will Receive
- Authentic Iwatani Financial Data: Comes pre-filled with historical and projected figures for thorough analysis of Iwatani Corporation (8088T).
- Completely Customizable Template: Easily adjust essential inputs such as revenue growth, WACC, and EBITDA percentage.
- Instant Calculations: Watch the intrinsic value of Iwatani Corporation (8088T) refresh in real time as you make adjustments.
- Expert Valuation Tool: Tailored for investors, analysts, and consultants looking for precise DCF outcomes.
- Intuitive Design: A straightforward layout with clear directions suitable for users of all experience levels.
Key Features
- Pre-Loaded Data: Iwatani Corporation's historical financial statements along with pre-filled forecasts.
- Fully Adjustable Inputs: Customize WACC, tax rates, revenue growth, and EBITDA margins.
- Instant Results: View Iwatani Corporation's intrinsic value recalculating in real time.
- Clear Visual Outputs: Dashboard charts showcase valuation results and essential metrics.
- Built for Accuracy: A professional tool designed for analysts, investors, and finance professionals.
How It Operates
- Step 1: Download the ready-to-use Excel template featuring Iwatani Corporation’s data.
- Step 2: Review the pre-populated sheets to familiarize yourself with the essential metrics.
- Step 3: Modify forecasts and assumptions in the editable yellow cells (WACC, growth, margins).
- Step 4: Immediately see recalibrated results, including the intrinsic value of Iwatani Corporation (8088T).
- Step 5: Utilize the outputs to make informed investment choices or create reports.
Why Choose This Calculator for Iwatani Corporation (8088T)?
- Reliable Data: Access to accurate Iwatani Corporation financials guarantees trustworthy valuation outcomes.
- Customizable Options: Tailor essential parameters such as growth rates, WACC, and tax rates to align with your forecasts.
- Save Time: Pre-configured calculations streamline the process, allowing you to avoid starting from scratch.
- Professional-Grade Resource: Specifically crafted for investors, analysts, and consultants focused on Iwatani Corporation.
- User-Friendly Interface: An intuitive design combined with clear, step-by-step guidance ensures ease of use for all individuals.
Who Can Benefit from This Product?
- Finance Students: Master valuation techniques and apply them to real-world data.
- Academics: Integrate advanced models into your teaching or research projects.
- Investors: Validate your assumptions and evaluate valuation results for Iwatani Corporation (8088T).
- Analysts: Enhance your efficiency with a customizable, ready-to-use DCF model.
- Small Business Owners: Discover how major public companies like Iwatani Corporation (8088T) are evaluated and analyzed.
Contents of the Template
- Preloaded Iwatani Data: Historical and projected financial metrics, including revenue, EBIT, and capital expenditures.
- DCF and WACC Models: Professional-grade templates for calculating intrinsic value and Weighted Average Cost of Capital.
- Editable Inputs: Yellow-highlighted cells for modifying revenue growth, tax rates, and discount rates.
- Financial Statements: Detailed annual and quarterly financials for in-depth analysis.
- Key Ratios: Profitability, leverage, and efficiency ratios for performance assessment.
- Dashboard and Charts: Visual representations of valuation results and underlying assumptions.
Disclaimer
All information, articles, and product details provided on this website are for general informational and educational purposes only. We do not claim any ownership over, nor do we intend to infringe upon, any trademarks, copyrights, logos, brand names, or other intellectual property mentioned or depicted on this site. Such intellectual property remains the property of its respective owners, and any references here are made solely for identification or informational purposes, without implying any affiliation, endorsement, or partnership.
We make no representations or warranties, express or implied, regarding the accuracy, completeness, or suitability of any content or products presented. Nothing on this website should be construed as legal, tax, investment, financial, medical, or other professional advice. In addition, no part of this site—including articles or product references—constitutes a solicitation, recommendation, endorsement, advertisement, or offer to buy or sell any securities, franchises, or other financial instruments, particularly in jurisdictions where such activity would be unlawful.
All content is of a general nature and may not address the specific circumstances of any individual or entity. It is not a substitute for professional advice or services. Any actions you take based on the information provided here are strictly at your own risk. You accept full responsibility for any decisions or outcomes arising from your use of this website and agree to release us from any liability in connection with your use of, or reliance upon, the content or products found herein.