
|
MOS Food Services, Inc. (8153.T) Évaluation DCF |
Entièrement Modifiable: Adapté À Vos Besoins Dans Excel Ou Sheets
Conception Professionnelle: Modèles Fiables Et Conformes Aux Normes Du Secteur
Pré-Construits Pour Une Utilisation Rapide Et Efficace
Compatible MAC/PC, entièrement débloqué
Aucune Expertise N'Est Requise; Facile À Suivre
Mos Food Services, Inc. (8153.T) Bundle
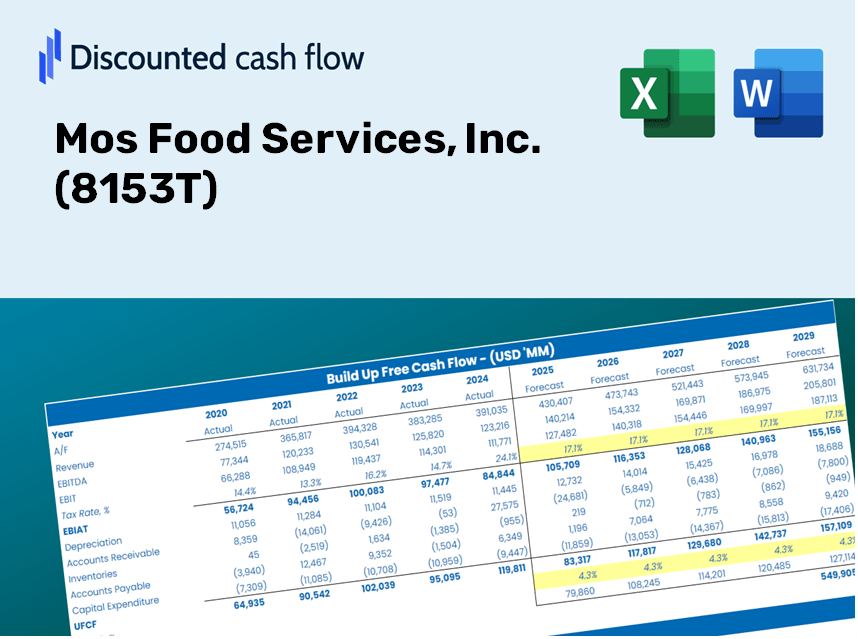
En tant qu'investisseur ou analyste, la calculatrice DCF MOS Food Services, Inc. (8153T) est votre ressource incontournable pour une évaluation précise. Avec de vraies données de MOS Food Services, Inc. déjà chargées, vous pouvez ajuster les prévisions et observer instantanément les effets.
Discounted Cash Flow (DCF) - (USD MM)
| Year | AY1 2020 |
AY2 2021 |
AY3 2022 |
AY4 2023 |
AY5 2024 |
FY1 2025 |
FY2 2026 |
FY3 2027 |
FY4 2028 |
FY5 2029 |
|---|---|---|---|---|---|---|---|---|---|---|
| Revenue | 71,972.0 | 78,447.0 | 85,059.0 | 93,058.0 | 96,185.0 | 103,444.4 | 111,251.8 | 119,648.4 | 128,678.7 | 138,390.6 |
| Revenue Growth, % | 0 | 9 | 8.43 | 9.4 | 3.36 | 7.55 | 7.55 | 7.55 | 7.55 | 7.55 |
| EBITDA | 5,451.0 | 8,769.0 | 4,436.0 | 9,086.0 | 9,169.0 | 8,950.8 | 9,626.3 | 10,352.9 | 11,134.2 | 11,974.6 |
| EBITDA, % | 7.57 | 11.18 | 5.22 | 9.76 | 9.53 | 8.65 | 8.65 | 8.65 | 8.65 | 8.65 |
| Depreciation | 3,924.0 | 4,060.0 | 4,200.0 | 4,775.0 | 4,292.0 | 5,205.1 | 5,597.9 | 6,020.4 | 6,474.8 | 6,963.5 |
| Depreciation, % | 5.45 | 5.18 | 4.94 | 5.13 | 4.46 | 5.03 | 5.03 | 5.03 | 5.03 | 5.03 |
| EBIT | 1,527.0 | 4,709.0 | 236.0 | 4,311.0 | 4,877.0 | 3,745.7 | 4,028.4 | 4,332.4 | 4,659.4 | 5,011.1 |
| EBIT, % | 2.12 | 6 | 0.27745 | 4.63 | 5.07 | 3.62 | 3.62 | 3.62 | 3.62 | 3.62 |
| Total Cash | 14,259.0 | 20,689.0 | 19,576.0 | 23,571.0 | 26,016.0 | 25,152.9 | 27,051.3 | 29,093.0 | 31,288.7 | 33,650.2 |
| Total Cash, percent | .0 | .0 | .0 | .0 | .0 | .0 | .0 | .0 | .0 | .0 |
| Account Receivables | 5,101.0 | 5,510.0 | 6,166.0 | 11,052.0 | 12,623.0 | 9,591.5 | 10,315.4 | 11,093.9 | 11,931.2 | 12,831.7 |
| Account Receivables, % | 7.09 | 7.02 | 7.25 | 11.88 | 13.12 | 9.27 | 9.27 | 9.27 | 9.27 | 9.27 |
| Inventories | 3,751.0 | 3,756.0 | 5,269.0 | 4,732.0 | 4,602.0 | 5,392.3 | 5,799.3 | 6,237.0 | 6,707.7 | 7,214.0 |
| Inventories, % | 5.21 | 4.79 | 6.19 | 5.09 | 4.78 | 5.21 | 5.21 | 5.21 | 5.21 | 5.21 |
| Accounts Payable | 4,569.0 | 5,139.0 | 5,378.0 | 5,650.0 | 5,895.0 | 6,500.9 | 6,991.5 | 7,519.2 | 8,086.7 | 8,697.1 |
| Accounts Payable, % | 6.35 | 6.55 | 6.32 | 6.07 | 6.13 | 6.28 | 6.28 | 6.28 | 6.28 | 6.28 |
| Capital Expenditure | -1,945.0 | -2,913.0 | -4,385.0 | -4,416.0 | -2,266.0 | -3,863.1 | -4,154.7 | -4,468.2 | -4,805.5 | -5,168.1 |
| Capital Expenditure, % | -2.7 | -3.71 | -5.16 | -4.75 | -2.36 | -3.73 | -3.73 | -3.73 | -3.73 | -3.73 |
| Tax Rate, % | 33.18 | 33.18 | 33.18 | 33.18 | 33.18 | 33.18 | 33.18 | 33.18 | 33.18 | 33.18 |
| EBITAT | 1,089.0 | 3,506.9 | -608.2 | 2,676.0 | 3,258.9 | 2,057.8 | 2,213.1 | 2,380.1 | 2,559.8 | 2,752.9 |
| Depreciation | ||||||||||
| Changes in Account Receivables | ||||||||||
| Changes in Inventories | ||||||||||
| Changes in Accounts Payable | ||||||||||
| Capital Expenditure | ||||||||||
| UFCF | -1,215.0 | 4,809.9 | -2,723.2 | -1,042.0 | 4,088.9 | 6,246.9 | 3,016.1 | 3,243.7 | 3,488.6 | 3,751.9 |
| WACC, % | 4.45 | 4.46 | 4.34 | 4.44 | 4.44 | 4.43 | 4.43 | 4.43 | 4.43 | 4.43 |
| PV UFCF | ||||||||||
| SUM PV UFCF | 17,551.8 | |||||||||
| Long Term Growth Rate, % | 3.30 | |||||||||
| Free cash flow (T + 1) | 3,876 | |||||||||
| Terminal Value | 344,375 | |||||||||
| Present Terminal Value | 277,332 | |||||||||
| Enterprise Value | 294,884 | |||||||||
| Net Debt | -19,872 | |||||||||
| Equity Value | 314,756 | |||||||||
| Diluted Shares Outstanding, MM | 31 | |||||||||
| Equity Value Per Share | 10,201.94 |
What You'll Receive
- Comprehensive MOS Financial Data: Loaded with historical and projected figures for Mos Food Services, Inc. for accurate analysis.
- Completely Customizable Template: Easily adjust critical inputs such as revenue growth, WACC, and EBITDA percentage.
- Instant Calculations: Watch the intrinsic value of Mos Food Services, Inc. update in real-time as you make adjustments.
- Professional Valuation Tool: Tailored for investors, analysts, and consultants in search of reliable DCF results.
- User-Friendly Interface: A straightforward layout with clear guidelines suitable for all skill levels.
Key Features
- Pre-Loaded Data: Mos Food Services, Inc.'s historical financial statements and ready-to-use forecasts.
- Fully Adjustable Inputs: Customize WACC, tax rates, revenue growth, and EBITDA margins to suit your analysis.
- Instant Results: Watch the intrinsic value of Mos Food Services, Inc. recalibrate in real time.
- Clear Visual Outputs: Interactive dashboard charts illustrate valuation results and essential metrics.
- Built for Accuracy: A precision tool designed for analysts, investors, and finance professionals.
How It Functions
- Step 1: Download the ready-to-use Excel template featuring Mos Food Services, Inc. (8153T) data.
- Step 2: Review the pre-populated sheets to familiarize yourself with the essential metrics.
- Step 3: Modify forecasts and assumptions in the editable yellow cells (WACC, growth rates, profit margins).
- Step 4: Instantly see updated results, including the intrinsic value of Mos Food Services, Inc. (8153T).
- Step 5: Use the outputs to make informed investment choices or create comprehensive reports.
Why Choose This Calculator for Mos Food Services, Inc. (8153T)?
- Reliable Data: Utilize authentic financial information from Mos Food Services for trustworthy valuation results.
- Tailored Options: Modify essential parameters such as growth rates, WACC, and tax rates to align with your forecasts.
- Efficiency Boost: Built-in calculations save time by removing the need to start from square one.
- Professional-Quality Tool: Crafted for the needs of investors, analysts, and consultants.
- Easy to Use: User-friendly interface coupled with clear step-by-step guidance ensures accessibility for everyone.
Who Can Benefit from Mos Food Services, Inc. (8153T)?
- Culinary Students: Discover food service management techniques and apply them in real-world scenarios.
- Researchers: Utilize industry models in your academic projects or studies related to food services.
- Food Investors: Evaluate your investment strategies and analyze performance metrics for Mos Food Services, Inc. (8153T).
- Market Analysts: Optimize your analysis process with a customizable model tailored for the food service industry.
- Entrepreneurs: Learn how major food service companies are evaluated and gain insights into industry trends.
What the Template Includes
- Pre-Filled DCF Model: Mos Food Services, Inc. (8153T) financial data preloaded for immediate use.
- WACC Calculator: Comprehensive calculations for Weighted Average Cost of Capital.
- Financial Ratios: Assess Mos Food Services, Inc. (8153T) profitability, leverage, and efficiency.
- Editable Inputs: Customize assumptions like growth, margins, and CAPEX to suit your scenarios.
- Financial Statements: Annual and quarterly reports for in-depth analysis.
- Interactive Dashboard: Easily visualize essential valuation metrics and outcomes.
Disclaimer
All information, articles, and product details provided on this website are for general informational and educational purposes only. We do not claim any ownership over, nor do we intend to infringe upon, any trademarks, copyrights, logos, brand names, or other intellectual property mentioned or depicted on this site. Such intellectual property remains the property of its respective owners, and any references here are made solely for identification or informational purposes, without implying any affiliation, endorsement, or partnership.
We make no representations or warranties, express or implied, regarding the accuracy, completeness, or suitability of any content or products presented. Nothing on this website should be construed as legal, tax, investment, financial, medical, or other professional advice. In addition, no part of this site—including articles or product references—constitutes a solicitation, recommendation, endorsement, advertisement, or offer to buy or sell any securities, franchises, or other financial instruments, particularly in jurisdictions where such activity would be unlawful.
All content is of a general nature and may not address the specific circumstances of any individual or entity. It is not a substitute for professional advice or services. Any actions you take based on the information provided here are strictly at your own risk. You accept full responsibility for any decisions or outcomes arising from your use of this website and agree to release us from any liability in connection with your use of, or reliance upon, the content or products found herein.