
|
Royal Holdings Co., Ltd. (8179.T) Évaluation DCF |
Entièrement Modifiable: Adapté À Vos Besoins Dans Excel Ou Sheets
Conception Professionnelle: Modèles Fiables Et Conformes Aux Normes Du Secteur
Pré-Construits Pour Une Utilisation Rapide Et Efficace
Compatible MAC/PC, entièrement débloqué
Aucune Expertise N'Est Requise; Facile À Suivre
ROYAL HOLDINGS Co., Ltd. (8179.T) Bundle
Explorez le potentiel financier de Royal Holdings Co., Ltd. (8179T) avec notre calculatrice DCF facile à utiliser! Entrez simplement vos hypothèses concernant la croissance, les marges et les dépenses pour déterminer la valeur intrinsèque de Royal Holdings Co., Ltd. (8179T) et améliorez votre stratégie d'investissement.
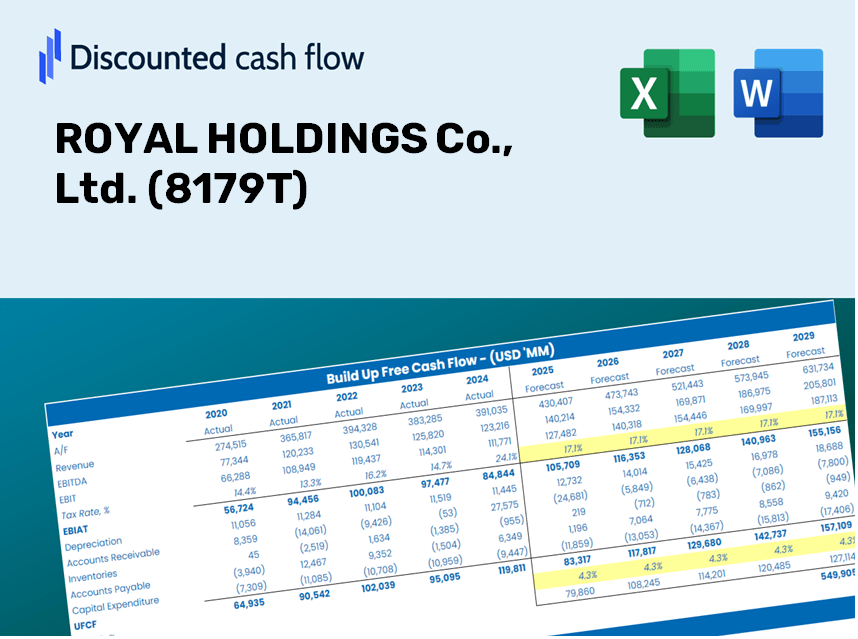
Discounted Cash Flow (DCF) - (USD MM)
| Year | AY1 2020 |
AY2 2021 |
AY3 2022 |
AY4 2023 |
AY5 2024 |
FY1 2025 |
FY2 2026 |
FY3 2027 |
FY4 2028 |
FY5 2029 |
|---|---|---|---|---|---|---|---|---|---|---|
| Revenue | 84,303.0 | 83,974.0 | 104,015.0 | 138,940.0 | 152,150.0 | 177,467.8 | 206,998.4 | 241,443.0 | 281,619.2 | 328,480.6 |
| Revenue Growth, % | 0 | -0.39026 | 23.87 | 33.58 | 9.51 | 16.64 | 16.64 | 16.64 | 16.64 | 16.64 |
| EBITDA | -19,917.0 | 4,076.0 | 7,044.0 | 11,485.0 | 13,684.0 | 1,867.1 | 2,177.8 | 2,540.2 | 2,962.9 | 3,455.9 |
| EBITDA, % | -23.63 | 4.85 | 6.77 | 8.27 | 8.99 | 1.05 | 1.05 | 1.05 | 1.05 | 1.05 |
| Depreciation | 6,176.0 | 5,228.0 | 4,851.0 | 6,218.0 | 6,754.0 | 9,629.3 | 11,231.7 | 13,100.6 | 15,280.5 | 17,823.2 |
| Depreciation, % | 7.33 | 6.23 | 4.66 | 4.48 | 4.44 | 5.43 | 5.43 | 5.43 | 5.43 | 5.43 |
| EBIT | -26,093.0 | -1,152.0 | 2,193.0 | 5,267.0 | 6,930.0 | -7,762.2 | -9,053.9 | -10,560.4 | -12,317.7 | -14,367.3 |
| EBIT, % | -30.95 | -1.37 | 2.11 | 3.79 | 4.55 | -4.37 | -4.37 | -4.37 | -4.37 | -4.37 |
| Total Cash | 13,884.0 | 23,113.0 | 25,653.0 | 26,394.0 | 19,349.0 | 35,624.8 | 41,552.7 | 48,467.1 | 56,532.1 | 65,939.0 |
| Total Cash, percent | .0 | .0 | .0 | .0 | .0 | .0 | .0 | .0 | .0 | .0 |
| Account Receivables | 4,655.0 | 5,605.0 | 7,544.0 | 8,145.0 | 9,690.0 | 11,244.4 | 13,115.5 | 15,297.9 | 17,843.5 | 20,812.7 |
| Account Receivables, % | 5.52 | 6.67 | 7.25 | 5.86 | 6.37 | 6.34 | 6.34 | 6.34 | 6.34 | 6.34 |
| Inventories | 2,047.0 | 2,202.0 | 2,867.0 | 2,989.0 | 2,922.0 | 4,216.1 | 4,917.7 | 5,736.0 | 6,690.4 | 7,803.7 |
| Inventories, % | 2.43 | 2.62 | 2.76 | 2.15 | 1.92 | 2.38 | 2.38 | 2.38 | 2.38 | 2.38 |
| Accounts Payable | 2,810.0 | 3,600.0 | 4,055.0 | 4,382.0 | 4,623.0 | 6,286.3 | 7,332.3 | 8,552.4 | 9,975.5 | 11,635.5 |
| Accounts Payable, % | 3.33 | 4.29 | 3.9 | 3.15 | 3.04 | 3.54 | 3.54 | 3.54 | 3.54 | 3.54 |
| Capital Expenditure | -2,903.0 | -2,025.0 | -2,010.0 | -5,079.0 | -7,142.0 | -5,727.6 | -6,680.7 | -7,792.3 | -9,089.0 | -10,601.4 |
| Capital Expenditure, % | -3.44 | -2.41 | -1.93 | -3.66 | -4.69 | -3.23 | -3.23 | -3.23 | -3.23 | -3.23 |
| Tax Rate, % | -2.24 | -2.24 | -2.24 | -2.24 | -2.24 | -2.24 | -2.24 | -2.24 | -2.24 | -2.24 |
| EBITAT | -27,544.2 | -1,241.4 | 2,311.3 | 5,179.7 | 7,085.4 | -7,736.5 | -9,023.8 | -10,525.4 | -12,276.9 | -14,319.7 |
| Depreciation | ||||||||||
| Changes in Account Receivables | ||||||||||
| Changes in Inventories | ||||||||||
| Changes in Accounts Payable | ||||||||||
| Capital Expenditure | ||||||||||
| UFCF | -28,163.2 | 1,646.6 | 3,003.3 | 5,922.7 | 5,460.4 | -5,020.0 | -5,999.5 | -6,997.8 | -8,162.2 | -9,520.4 |
| WACC, % | 4.45 | 4.45 | 4.45 | 4.43 | 4.45 | 4.44 | 4.44 | 4.44 | 4.44 | 4.44 |
| PV UFCF | ||||||||||
| SUM PV UFCF | -30,967.7 | |||||||||
| Long Term Growth Rate, % | 3.00 | |||||||||
| Free cash flow (T + 1) | -9,806 | |||||||||
| Terminal Value | -679,188 | |||||||||
| Present Terminal Value | -546,483 | |||||||||
| Enterprise Value | -577,451 | |||||||||
| Net Debt | 30,632 | |||||||||
| Equity Value | -608,083 | |||||||||
| Diluted Shares Outstanding, MM | 49 | |||||||||
| Equity Value Per Share | -12,354.37 |
What You Will Receive
- Modifiable Financial Assumptions: Adjust parameters (growth %, profit margins, discount rates) to explore various scenarios.
- Real-Time Data: Pre-loaded financial information for ROYAL HOLDINGS Co., Ltd. (8179T) to enhance your analysis.
- Automated DCF Calculations: The model automatically computes Net Present Value (NPV) and intrinsic value for you.
- Professional and Adaptable: A sleek Excel framework that tailors itself to your valuation requirements.
- Designed for Analysts and Investors: Perfect for evaluating forecasts, assessing strategies, and optimizing efficiency.
Key Features
- Comprehensive Historical Data: ROYAL HOLDINGS Co., Ltd.'s (8179T) financial statements and established forecasts at your fingertips.
- Customizable Variables: Modify WACC, tax rates, revenue growth, and EBITDA margins to suit your analysis.
- Real-Time Insights: Instantly view the recalculated intrinsic value of ROYAL HOLDINGS Co., Ltd. (8179T).
- Intuitive Visual Representations: Dynamic dashboard charts illustrate valuation outcomes and essential metrics.
- Designed for Precision: A robust solution tailored for analysts, investors, and finance professionals.
How It Works
- Step 1: Download the Excel file for ROYAL HOLDINGS Co., Ltd. (8179T).
- Step 2: Review the pre-filled data for ROYAL HOLDINGS, including historical and projected figures.
- Step 3: Modify the key assumptions (highlighted in yellow) based on your analysis.
- Step 4: Observe the automatic recalculations for the intrinsic value of ROYAL HOLDINGS (8179T).
- Step 5: Utilize the results for your investment decisions or reporting needs.
Why Opt for ROYAL HOLDINGS Co., Ltd. ([8179T]) Calculator?
- Designed for Experts: A sophisticated tool tailored for analysts, CFOs, and financial consultants.
- Comprehensive Data: Preloaded with ROYAL HOLDINGS' historical and projected financials for precision.
- Dynamic Forecasting: Effortlessly test various scenarios and assumptions.
- Insightful Results: Instantly calculates intrinsic value, NPV, and essential metrics.
- User-Friendly: Detailed, step-by-step instructions navigate you through the process.
Who Can Benefit from ROYAL HOLDINGS Co., Ltd. [8179T]?
- Investors: Evaluate the market position of ROYAL HOLDINGS Co., Ltd. before making investment decisions.
- CFOs and Financial Analysts: Optimize valuation methodologies and assess financial forecasts.
- Startup Founders: Gain insights into how established companies like ROYAL HOLDINGS Co., Ltd. are valued.
- Consultants: Provide comprehensive valuation analyses for your clients based on ROYAL HOLDINGS Co., Ltd.
- Students and Educators: Utilize real-time data from ROYAL HOLDINGS Co., Ltd. to enhance learning and teach valuation strategies.
Contents of the Template
- Preloaded ROYAL HOLDINGS Data: Historical and forecasted financial metrics, including revenue, EBIT, and capital expenditures.
- DCF and WACC Models: Advanced spreadsheets for determining intrinsic value and Weighted Average Cost of Capital.
- Editable Inputs: Cells highlighted in yellow for modifying revenue growth, tax rates, and discount rates.
- Financial Statements: Detailed annual and quarterly financials for thorough analysis.
- Key Ratios: Profitability, leverage, and efficiency ratios to assess performance.
- Dashboard and Charts: Visual representations of valuation results and underlying assumptions.
Disclaimer
All information, articles, and product details provided on this website are for general informational and educational purposes only. We do not claim any ownership over, nor do we intend to infringe upon, any trademarks, copyrights, logos, brand names, or other intellectual property mentioned or depicted on this site. Such intellectual property remains the property of its respective owners, and any references here are made solely for identification or informational purposes, without implying any affiliation, endorsement, or partnership.
We make no representations or warranties, express or implied, regarding the accuracy, completeness, or suitability of any content or products presented. Nothing on this website should be construed as legal, tax, investment, financial, medical, or other professional advice. In addition, no part of this site—including articles or product references—constitutes a solicitation, recommendation, endorsement, advertisement, or offer to buy or sell any securities, franchises, or other financial instruments, particularly in jurisdictions where such activity would be unlawful.
All content is of a general nature and may not address the specific circumstances of any individual or entity. It is not a substitute for professional advice or services. Any actions you take based on the information provided here are strictly at your own risk. You accept full responsibility for any decisions or outcomes arising from your use of this website and agree to release us from any liability in connection with your use of, or reliance upon, the content or products found herein.