
|
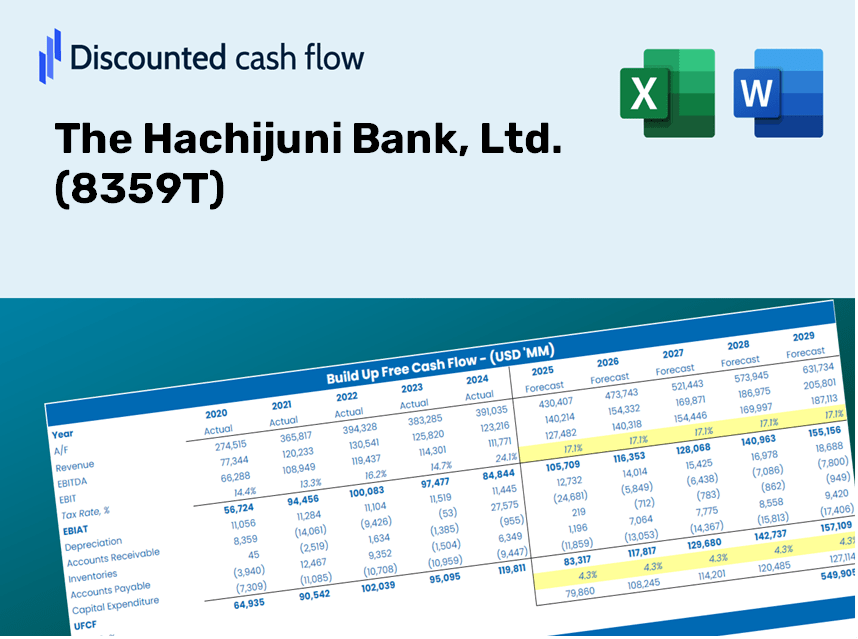
The Hachijuni Bank, Ltd. (8359.T) Valuation DCF |
Entièrement Modifiable: Adapté À Vos Besoins Dans Excel Ou Sheets
Conception Professionnelle: Modèles Fiables Et Conformes Aux Normes Du Secteur
Pré-Construits Pour Une Utilisation Rapide Et Efficace
Compatible MAC/PC, entièrement débloqué
Aucune Expertise N'Est Requise; Facile À Suivre
The Hachijuni Bank, Ltd. (8359.T) Bundle
Vous cherchez à évaluer la valeur intrinsèque de la Hachijuni Bank, Ltd.? Notre (8359T) Calculator DCF intègre des données réelles avec des fonctionnalités de personnalisation approfondies, vous permettant d'ajuster les prévisions et de faire des choix d'investissement plus éclairés.
Discounted Cash Flow (DCF) - (USD MM)
| Year | AY1 2021 |
AY2 2022 |
AY3 2023 |
AY4 2024 |
AY5 2025 |
FY1 2026 |
FY2 2027 |
FY3 2028 |
FY4 2029 |
FY5 2030 |
|---|---|---|---|---|---|---|---|---|---|---|
| Revenue | 146,552.0 | 145,746.0 | 178,723.0 | 172,764.0 | 205,843.0 | 225,341.0 | 246,685.9 | 270,052.7 | 295,632.8 | 323,636.0 |
| Revenue Growth, % | 0 | -0.54998 | 22.63 | -3.33 | 19.15 | 9.47 | 9.47 | 9.47 | 9.47 | 9.47 |
| EBITDA | 25,169.0 | 43,615.0 | 40,291.0 | 56,794.0 | 71,049.0 | 61,758.4 | 67,608.3 | 74,012.3 | 81,023.0 | 88,697.7 |
| EBITDA, % | 17.17 | 29.93 | 22.54 | 32.87 | 34.52 | 27.41 | 27.41 | 27.41 | 27.41 | 27.41 |
| Depreciation | .0 | 5,560.0 | 5,543.0 | 5,965.0 | 6,186.0 | 6,027.5 | 6,598.5 | 7,223.5 | 7,907.7 | 8,656.7 |
| Depreciation, % | 0 | 3.81 | 3.1 | 3.45 | 3.01 | 2.67 | 2.67 | 2.67 | 2.67 | 2.67 |
| EBIT | 25,169.0 | 38,055.0 | 34,748.0 | 50,829.0 | 64,863.0 | 55,730.9 | 61,009.8 | 66,788.9 | 73,115.3 | 80,041.0 |
| EBIT, % | 17.17 | 26.11 | 19.44 | 29.42 | 31.51 | 24.73 | 24.73 | 24.73 | 24.73 | 24.73 |
| Total Cash | 2,753,959.0 | 4,063,012.0 | 3,600,693.0 | 3,717,670.0 | 3,027,055.0 | 225,341.0 | 246,685.9 | 270,052.7 | 295,632.8 | 323,636.0 |
| Total Cash, percent | .0 | .0 | .0 | .0 | .0 | .0 | .0 | .0 | .0 | .0 |
| Account Receivables | .0 | .0 | .0 | .0 | .0 | .0 | .0 | .0 | .0 | .0 |
| Account Receivables, % | 0 | 0 | 0 | 0 | 0 | 0 | 0 | 0 | 0 | 0 |
| Inventories | .0 | .0 | .0 | .0 | .0 | .0 | .0 | .0 | .0 | .0 |
| Inventories, % | 0 | 0 | 0 | 0 | 0 | 0 | 0 | 0 | 0 | 0 |
| Accounts Payable | .0 | .0 | .0 | .0 | .0 | .0 | .0 | .0 | .0 | .0 |
| Accounts Payable, % | 0 | 0 | 0 | 0 | 0 | 0 | 0 | 0 | 0 | 0 |
| Capital Expenditure | -6,887.0 | -8,224.0 | -7,367.0 | -8,547.0 | -9,517.0 | -10,832.0 | -11,858.0 | -12,981.3 | -14,210.9 | -15,557.0 |
| Capital Expenditure, % | -4.7 | -5.64 | -4.12 | -4.95 | -4.62 | -4.81 | -4.81 | -4.81 | -4.81 | -4.81 |
| Tax Rate, % | 25.66 | 25.66 | 25.66 | 25.66 | 25.66 | 25.66 | 25.66 | 25.66 | 25.66 | 25.66 |
| EBITAT | 17,708.1 | 26,667.0 | 24,135.7 | 37,071.0 | 48,216.0 | 39,809.5 | 43,580.4 | 47,708.5 | 52,227.5 | 57,174.7 |
| Depreciation | ||||||||||
| Changes in Account Receivables | ||||||||||
| Changes in Inventories | ||||||||||
| Changes in Accounts Payable | ||||||||||
| Capital Expenditure | ||||||||||
| UFCF | 10,821.1 | 24,003.0 | 22,311.7 | 34,489.0 | 44,885.0 | 35,005.0 | 38,320.8 | 41,950.7 | 45,924.3 | 50,274.4 |
| WACC, % | 3.31 | 3.3 | 3.28 | 3.38 | 3.42 | 3.34 | 3.34 | 3.34 | 3.34 | 3.34 |
| PV UFCF | ||||||||||
| SUM PV UFCF | 190,694.0 | |||||||||
| Long Term Growth Rate, % | 2.00 | |||||||||
| Free cash flow (T + 1) | 51,280 | |||||||||
| Terminal Value | 3,824,973 | |||||||||
| Present Terminal Value | 3,245,430 | |||||||||
| Enterprise Value | 3,436,124 | |||||||||
| Net Debt | -1,346,603 | |||||||||
| Equity Value | 4,782,727 | |||||||||
| Diluted Shares Outstanding, MM | 474 | |||||||||
| Equity Value Per Share | 10,083.99 |
Benefits You Will Receive
- Customizable Excel Template: An adaptable Excel-based DCF Calculator featuring pre-loaded financial data for Hachijuni Bank, Ltd. (8359T).
- Actual Financial Data: Access to historical performance metrics and forward-looking projections (displayed in highlighted cells).
- Flexible Forecasting: Adjust key assumptions such as revenue growth rates, EBITDA percentages, and WACC.
- Instant Calculations: Quickly observe how your inputs influence Hachijuni Bank, Ltd.'s (8359T) valuation.
- Professional-Grade Tool: Designed for use by investors, CFOs, consultants, and financial analysts.
- User-Centric Interface: Organized for straightforward navigation and enhanced usability, complete with detailed instructions.
Key Features
- Customizable Financial Inputs: Adjust essential parameters such as loan growth, interest rates, and operational expenses.
- Instant DCF Valuation: Quickly computes intrinsic value, net present value, and other financial metrics.
- High-Precision Accuracy: Relies on Hachijuni Bank's actual financial data to ensure realistic valuation results.
- Effortless Scenario Analysis: Easily evaluate various assumptions and compare different outcomes.
- Efficiency-Boosting Solution: No need to create intricate valuation models from the ground up.
How It Operates
- Download the Template: Gain immediate access to the Excel-based Hachijuni Bank DCF Calculator.
- Input Your Assumptions: Modify the yellow-highlighted cells for growth rates, WACC, profit margins, and other variables.
- Instant Calculations: The model automatically recalculates the intrinsic value of Hachijuni Bank.
- Test Scenarios: Explore various assumptions to assess changes in valuation.
- Analyze and Decide: Use the findings to inform your investment strategy or financial assessment.
Why Choose This Calculator for The Hachijuni Bank, Ltd. (8359T)?
- Reliable Data: Accurate financial information from The Hachijuni Bank ensures dependable valuation outcomes.
- Tailorable: Modify essential parameters such as growth rates, WACC, and tax rates to align with your forecasts.
- Efficient: Built-in calculations save time, letting you avoid starting from the ground up.
- Professional Tool: Crafted for investors, analysts, and financial consultants working with The Hachijuni Bank.
- User-Friendly: A straightforward design and clear instructions make it accessible for all users.
Who Should Use This Product?
- Investors: Make informed decisions by accurately assessing the fair value of The Hachijuni Bank, Ltd. (8359T).
- CFOs: Utilize a high-quality DCF model for comprehensive financial reporting and analysis.
- Consultants: Swiftly customize the template for client valuation reports.
- Entrepreneurs: Discover financial modeling insights employed by leading firms.
- Educators: Implement it as a teaching resource to illustrate valuation techniques.
Contents of the Template
- Historical Data: Incorporates The Hachijuni Bank, Ltd.'s past financial performance and foundational forecasts.
- DCF and Levered DCF Models: Comprehensive templates designed to assess the intrinsic value of The Hachijuni Bank, Ltd. (8359T).
- WACC Sheet: Pre-configured calculations for the Weighted Average Cost of Capital.
- Editable Inputs: Adjust key parameters such as growth rates, EBITDA percentages, and CAPEX assumptions.
- Quarterly and Annual Statements: A detailed analysis of The Hachijuni Bank, Ltd.'s financials.
- Interactive Dashboard: Dynamic visualization of valuation outcomes and future projections.
Disclaimer
All information, articles, and product details provided on this website are for general informational and educational purposes only. We do not claim any ownership over, nor do we intend to infringe upon, any trademarks, copyrights, logos, brand names, or other intellectual property mentioned or depicted on this site. Such intellectual property remains the property of its respective owners, and any references here are made solely for identification or informational purposes, without implying any affiliation, endorsement, or partnership.
We make no representations or warranties, express or implied, regarding the accuracy, completeness, or suitability of any content or products presented. Nothing on this website should be construed as legal, tax, investment, financial, medical, or other professional advice. In addition, no part of this site—including articles or product references—constitutes a solicitation, recommendation, endorsement, advertisement, or offer to buy or sell any securities, franchises, or other financial instruments, particularly in jurisdictions where such activity would be unlawful.
All content is of a general nature and may not address the specific circumstances of any individual or entity. It is not a substitute for professional advice or services. Any actions you take based on the information provided here are strictly at your own risk. You accept full responsibility for any decisions or outcomes arising from your use of this website and agree to release us from any liability in connection with your use of, or reliance upon, the content or products found herein.