
|
Hokuhoku Financial Group, Inc. (8377.T) Évaluation DCF |
Entièrement Modifiable: Adapté À Vos Besoins Dans Excel Ou Sheets
Conception Professionnelle: Modèles Fiables Et Conformes Aux Normes Du Secteur
Pré-Construits Pour Une Utilisation Rapide Et Efficace
Compatible MAC/PC, entièrement débloqué
Aucune Expertise N'Est Requise; Facile À Suivre
Hokuhoku Financial Group, Inc. (8377.T) Bundle
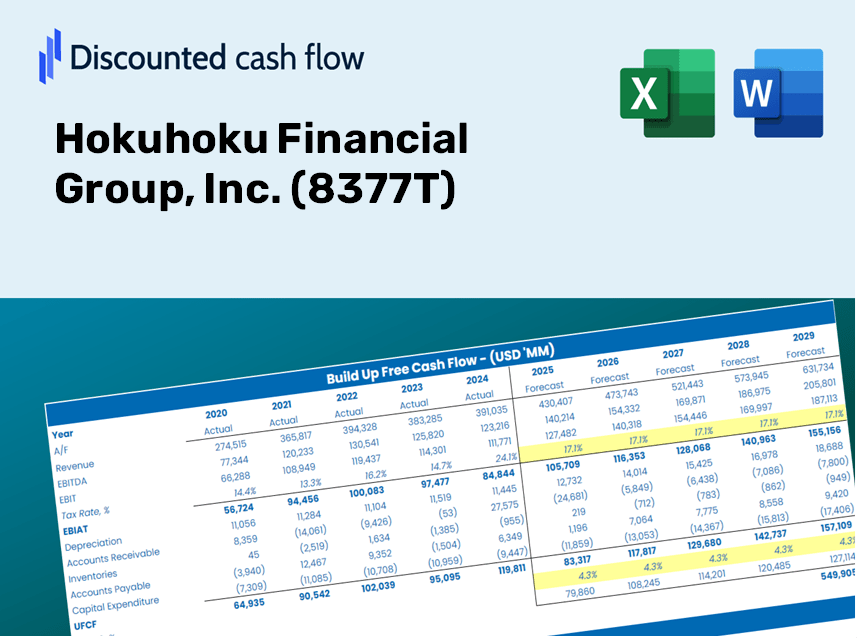
Que vous soyez un investisseur ou un analyste, ce (8377T) Calculator DCF est votre ressource incontournable pour une évaluation précise. Chargé de données réelles de Hokuhoku Financial Group, Inc., vous pouvez ajuster les prévisions et observer les effets en temps réel.
Discounted Cash Flow (DCF) - (USD MM)
| Year | AY1 2020 |
AY2 2021 |
AY3 2022 |
AY4 2023 |
AY5 2024 |
FY1 2025 |
FY2 2026 |
FY3 2027 |
FY4 2028 |
FY5 2029 |
|---|---|---|---|---|---|---|---|---|---|---|
| Revenue | 160,604.0 | 162,336.0 | 173,373.0 | 160,487.0 | 175,953.0 | 180,387.8 | 184,934.3 | 189,595.4 | 194,374.0 | 199,273.0 |
| Revenue Growth, % | 0 | 1.08 | 6.8 | -7.43 | 9.64 | 2.52 | 2.52 | 2.52 | 2.52 | 2.52 |
| EBITDA | 32,048.0 | 42,017.0 | 33,817.0 | .0 | 62,156.0 | 36,318.6 | 37,234.0 | 38,172.4 | 39,134.5 | 40,120.9 |
| EBITDA, % | 19.95 | 25.88 | 19.51 | 0 | 35.33 | 20.13 | 20.13 | 20.13 | 20.13 | 20.13 |
| Depreciation | .0 | 8,784.0 | 8,086.0 | 8,111.0 | 8,417.0 | 7,184.0 | 7,365.0 | 7,550.7 | 7,741.0 | 7,936.1 |
| Depreciation, % | 0 | 5.41 | 4.66 | 5.05 | 4.78 | 3.98 | 3.98 | 3.98 | 3.98 | 3.98 |
| EBIT | 32,048.0 | 33,233.0 | 25,731.0 | -8,111.0 | 53,739.0 | 29,134.6 | 29,868.9 | 30,621.7 | 31,393.5 | 32,184.8 |
| EBIT, % | 19.95 | 20.47 | 14.84 | -5.05 | 30.54 | 16.15 | 16.15 | 16.15 | 16.15 | 16.15 |
| Total Cash | 5,096,491.0 | 5,471,090.0 | 4,357,148.0 | 4,550,493.0 | 3,191,879.0 | 180,387.8 | 184,934.3 | 189,595.4 | 194,374.0 | 199,273.0 |
| Total Cash, percent | .0 | .0 | .0 | .0 | .0 | .0 | .0 | .0 | .0 | .0 |
| Account Receivables | .0 | .0 | .0 | .0 | .0 | .0 | .0 | .0 | .0 | .0 |
| Account Receivables, % | 0 | 0 | 0 | 0 | 0 | 0 | 0 | 0 | 0 | 0 |
| Inventories | .0 | .0 | .0 | .0 | .0 | .0 | .0 | .0 | .0 | .0 |
| Inventories, % | 0 | 0 | 0 | 0 | 0 | 0 | 0 | 0 | 0 | 0 |
| Accounts Payable | .0 | .0 | .0 | .0 | .0 | .0 | .0 | .0 | .0 | .0 |
| Accounts Payable, % | 0 | 0 | 0 | 0 | 0 | 0 | 0 | 0 | 0 | 0 |
| Capital Expenditure | -4,858.0 | -9,799.0 | -7,258.0 | -17,230.0 | -5,956.0 | -9,873.9 | -10,122.7 | -10,377.9 | -10,639.4 | -10,907.6 |
| Capital Expenditure, % | -3.02 | -6.04 | -4.19 | -10.74 | -3.38 | -5.47 | -5.47 | -5.47 | -5.47 | -5.47 |
| Tax Rate, % | 27.29 | 27.29 | 27.29 | 27.29 | 27.29 | 27.29 | 27.29 | 27.29 | 27.29 | 27.29 |
| EBITAT | 21,930.0 | 20,526.0 | 21,435.0 | -7,246.1 | 39,072.0 | 21,882.5 | 22,434.0 | 22,999.4 | 23,579.1 | 24,173.4 |
| Depreciation | ||||||||||
| Changes in Account Receivables | ||||||||||
| Changes in Inventories | ||||||||||
| Changes in Accounts Payable | ||||||||||
| Capital Expenditure | ||||||||||
| UFCF | 17,072.0 | 19,511.0 | 22,263.0 | -16,365.1 | 41,533.0 | 19,192.5 | 19,676.3 | 20,172.2 | 20,680.6 | 21,201.9 |
| WACC, % | 2.92 | 2.74 | 3.34 | 3.51 | 3.04 | 3.11 | 3.11 | 3.11 | 3.11 | 3.11 |
| PV UFCF | ||||||||||
| SUM PV UFCF | 92,010.7 | |||||||||
| Long Term Growth Rate, % | 2.00 | |||||||||
| Free cash flow (T + 1) | 21,626 | |||||||||
| Terminal Value | 1,948,738 | |||||||||
| Present Terminal Value | 1,672,072 | |||||||||
| Enterprise Value | 1,764,083 | |||||||||
| Net Debt | -1,811,892 | |||||||||
| Equity Value | 3,575,975 | |||||||||
| Diluted Shares Outstanding, MM | 124 | |||||||||
| Equity Value Per Share | 28,936.05 |
What You Will Receive
- Authentic (8377T) Financial Data: Comprehensive historical and projected metrics for precise evaluation.
- Customizable Parameters: Adjust inputs such as WACC, tax rates, revenue growth, and capital expenditures.
- Real-Time Calculations: Dynamic computation of intrinsic value and NPV.
- Scenario Analysis: Explore various scenarios to assess the future outlook of Hokuhoku Financial Group.
- User-Friendly Interface: Designed for professionals but easy to navigate for novices.
Key Features
- Authentic Financial Data: Gain access to precise historical figures and future forecasts tailored for Hokuhoku Financial Group, Inc. (8377T).
- Adjustable Projections: Modify the yellow-highlighted fields such as WACC, growth rates, and profit margins to suit your analysis.
- Responsive Calculations: Experience real-time updates for DCF, Net Present Value (NPV), and cash flow evaluations.
- Intuitive Dashboard: Easily digestible charts and summaries to help you visualize your valuation insights.
- Designed for All Skill Levels: An organized and user-friendly layout crafted for investors, CFOs, and consultants alike.
How It Works
- Step 1: Download the prebuilt Excel template featuring data for Hokuhoku Financial Group, Inc. (8377T).
- Step 2: Review the pre-filled sheets to familiarize yourself with the essential metrics.
- Step 3: Adjust forecasts and assumptions in the editable yellow cells (WACC, growth, margins).
- Step 4: Instantly view the recalculated results, including Hokuhoku’s intrinsic value.
- Step 5: Make well-informed investment decisions or create reports based on the outputs.
Why Choose the Hokuhoku Financial Group Calculator?
- Precision: Leveraging genuine Hokuhoku financial data for reliable results.
- Adaptability: Tailored for users to easily test and adjust their inputs.
- Efficiency: Eliminate the need to create a DCF model from the ground up.
- Expert-Level: Crafted with the accuracy and usability expected at the CFO level.
- Intuitive Design: Simple to navigate, even for those with limited financial modeling skills.
Who Can Benefit from Hokuhoku Financial Group, Inc. (8377T)?
- Institutional Investors: Develop comprehensive and accurate valuation models for investment analysis.
- Corporate Finance Departments: Evaluate valuation scenarios to inform strategic decision-making.
- Financial Consultants: Deliver precise valuation insights to clients focusing on Hokuhoku Financial Group, Inc. (8377T).
- Students and Instructors: Utilize real-world financial data for hands-on learning and teaching in financial modeling.
- Finance Enthusiasts: Gain an understanding of how companies like Hokuhoku Financial Group, Inc. (8377T) are valued in the financial landscape.
Contents of the Template
- Pre-Filled Data: Contains Hokuhoku Financial Group, Inc.'s historical financial information and projections.
- Discounted Cash Flow Model: Editable DCF valuation model with automated calculations.
- Weighted Average Cost of Capital (WACC): A dedicated page for calculating WACC using customized inputs.
- Key Financial Ratios: Evaluate Hokuhoku Financial Group, Inc.'s profitability, efficiency, and leverage metrics.
- Customizable Inputs: Easily modify revenue growth, profit margins, and tax rates.
- Clear Dashboard: Visual aids and tables summarizing essential valuation outcomes.
Disclaimer
All information, articles, and product details provided on this website are for general informational and educational purposes only. We do not claim any ownership over, nor do we intend to infringe upon, any trademarks, copyrights, logos, brand names, or other intellectual property mentioned or depicted on this site. Such intellectual property remains the property of its respective owners, and any references here are made solely for identification or informational purposes, without implying any affiliation, endorsement, or partnership.
We make no representations or warranties, express or implied, regarding the accuracy, completeness, or suitability of any content or products presented. Nothing on this website should be construed as legal, tax, investment, financial, medical, or other professional advice. In addition, no part of this site—including articles or product references—constitutes a solicitation, recommendation, endorsement, advertisement, or offer to buy or sell any securities, franchises, or other financial instruments, particularly in jurisdictions where such activity would be unlawful.
All content is of a general nature and may not address the specific circumstances of any individual or entity. It is not a substitute for professional advice or services. Any actions you take based on the information provided here are strictly at your own risk. You accept full responsibility for any decisions or outcomes arising from your use of this website and agree to release us from any liability in connection with your use of, or reliance upon, the content or products found herein.