
|
The San-in Godo Bank, Ltd. (8381.T) Valation DCF |
Entièrement Modifiable: Adapté À Vos Besoins Dans Excel Ou Sheets
Conception Professionnelle: Modèles Fiables Et Conformes Aux Normes Du Secteur
Pré-Construits Pour Une Utilisation Rapide Et Efficace
Compatible MAC/PC, entièrement débloqué
Aucune Expertise N'Est Requise; Facile À Suivre
The San-in Godo Bank, Ltd. (8381.T) Bundle
Améliorez vos choix d'investissement avec la calculatrice (8381T) DCF! Utilisez des données financières authentiques San-in Godo Bank, ajustez les projections et dépenses de croissance et observez instantanément comment ces ajustements affectent la valeur intrinsèque de (8381T).
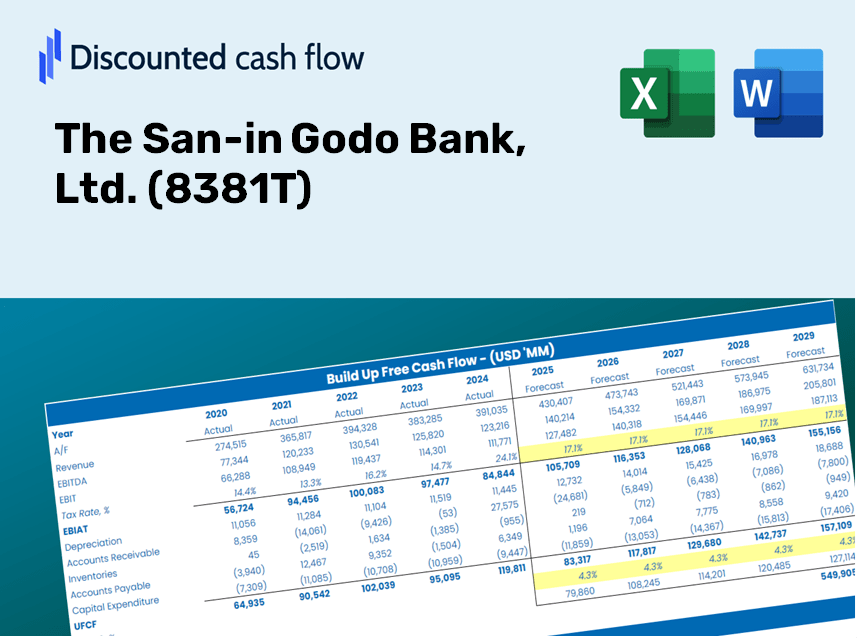
Discounted Cash Flow (DCF) - (USD MM)
| Year | AY1 2020 |
AY2 2021 |
AY3 2022 |
AY4 2023 |
AY5 2024 |
FY1 2025 |
FY2 2026 |
FY3 2027 |
FY4 2028 |
FY5 2029 |
|---|---|---|---|---|---|---|---|---|---|---|
| Revenue | 84,962.0 | 90,769.0 | 105,515.0 | 115,512.0 | 130,123.0 | 144,828.1 | 161,195.1 | 179,411.7 | 199,687.0 | 222,253.5 |
| Revenue Growth, % | 0 | 6.83 | 16.25 | 9.47 | 12.65 | 11.3 | 11.3 | 11.3 | 11.3 | 11.3 |
| EBITDA | 13,456.0 | 23,286.0 | 24,941.0 | .0 | 29,499.0 | 25,431.6 | 28,305.6 | 31,504.4 | 35,064.7 | 39,027.4 |
| EBITDA, % | 15.84 | 25.65 | 23.64 | 0 | 22.67 | 17.56 | 17.56 | 17.56 | 17.56 | 17.56 |
| Depreciation | .0 | 3,003.0 | 3,053.0 | 3,085.0 | 3,181.0 | 3,278.1 | 3,648.5 | 4,060.9 | 4,519.8 | 5,030.6 |
| Depreciation, % | 0 | 3.31 | 2.89 | 2.67 | 2.44 | 2.26 | 2.26 | 2.26 | 2.26 | 2.26 |
| EBIT | 13,456.0 | 20,283.0 | 21,888.0 | -3,085.0 | 26,318.0 | 22,153.5 | 24,657.1 | 27,443.6 | 30,545.0 | 33,996.8 |
| EBIT, % | 15.84 | 22.35 | 20.74 | -2.67 | 20.23 | 15.3 | 15.3 | 15.3 | 15.3 | 15.3 |
| Total Cash | 872,988.0 | 775,086.0 | 820,839.0 | 886,423.0 | 1,220,745.0 | 144,828.1 | 161,195.1 | 179,411.7 | 199,687.0 | 222,253.5 |
| Total Cash, percent | .0 | .0 | .0 | .0 | .0 | .0 | .0 | .0 | .0 | .0 |
| Account Receivables | .0 | .0 | .0 | .0 | .0 | .0 | .0 | .0 | .0 | .0 |
| Account Receivables, % | 0 | 0 | 0 | 0 | 0 | 0 | 0 | 0 | 0 | 0 |
| Inventories | .0 | .0 | .0 | .0 | .0 | .0 | .0 | .0 | .0 | .0 |
| Inventories, % | 0 | 0 | 0 | 0 | 0 | 0 | 0 | 0 | 0 | 0 |
| Accounts Payable | .0 | .0 | .0 | .0 | .0 | .0 | .0 | .0 | .0 | .0 |
| Accounts Payable, % | 0 | 0 | 0 | 0 | 0 | 0 | 0 | 0 | 0 | 0 |
| Capital Expenditure | -1,336.0 | -3,077.0 | -3,395.0 | -1,396.0 | -2,789.0 | -3,340.3 | -3,717.8 | -4,137.9 | -4,605.5 | -5,126.0 |
| Capital Expenditure, % | -1.57 | -3.39 | -3.22 | -1.21 | -2.14 | -2.31 | -2.31 | -2.31 | -2.31 | -2.31 |
| Tax Rate, % | 28.8 | 28.8 | 28.8 | 28.8 | 28.8 | 28.8 | 28.8 | 28.8 | 28.8 | 28.8 |
| EBITAT | 9,193.2 | 14,485.0 | 15,463.0 | -2,100.9 | 18,738.0 | 15,493.4 | 17,244.3 | 19,193.0 | 21,362.0 | 23,776.1 |
| Depreciation | ||||||||||
| Changes in Account Receivables | ||||||||||
| Changes in Inventories | ||||||||||
| Changes in Accounts Payable | ||||||||||
| Capital Expenditure | ||||||||||
| UFCF | 7,857.2 | 14,411.0 | 15,121.0 | -411.9 | 19,130.0 | 15,431.2 | 17,175.0 | 19,116.0 | 21,276.3 | 23,680.7 |
| WACC, % | 2.71 | 2.8 | 2.78 | 2.7 | 2.8 | 2.76 | 2.76 | 2.76 | 2.76 | 2.76 |
| PV UFCF | ||||||||||
| SUM PV UFCF | 88,654.0 | |||||||||
| Long Term Growth Rate, % | 2.00 | |||||||||
| Free cash flow (T + 1) | 24,154 | |||||||||
| Terminal Value | 3,190,542 | |||||||||
| Present Terminal Value | 2,784,878 | |||||||||
| Enterprise Value | 2,873,532 | |||||||||
| Net Debt | -438,920 | |||||||||
| Equity Value | 3,312,452 | |||||||||
| Diluted Shares Outstanding, MM | 152 | |||||||||
| Equity Value Per Share | 21,725.55 |
What You Will Receive
- Authentic San-in Godo Financials: Access historical and projected data for precise valuation.
- Customizable Inputs: Adjust metrics such as WACC, tax rates, revenue growth, and capital expenditures.
- Dynamic Calculations: Automatically calculates intrinsic value and NPV in real-time.
- Scenario Analysis: Evaluate multiple scenarios to assess the future performance of The San-in Godo Bank, Ltd. (8381T).
- User-Friendly Design: Created for professionals but easy for beginners to navigate.
Key Features
- Pre-Loaded Data: The San-in Godo Bank's historical financial statements and pre-filled forecasts.
- Fully Adjustable Inputs: Modify WACC, tax rates, revenue growth, and EBITDA margins as needed.
- Instant Results: Witness the recalculation of The San-in Godo Bank's intrinsic value in real time.
- Clear Visual Outputs: Dashboard charts present valuation results and essential metrics.
- Built for Accuracy: A specialized tool designed for analysts, investors, and finance professionals.
How It Works
- Step 1: Download the prebuilt Excel template featuring data for The San-in Godo Bank, Ltd. (8381T).
- Step 2: Review the pre-filled sheets to familiarize yourself with the essential metrics.
- Step 3: Modify forecasts and assumptions in the editable yellow cells (WACC, growth, margins).
- Step 4: Instantly view the recalculated results, including the intrinsic value of The San-in Godo Bank, Ltd. (8381T).
- Step 5: Use the outputs to make well-informed investment decisions or create reports.
Why Choose This Calculator for The San-in Godo Bank, Ltd. (8381T)?
- User-Friendly Interface: Tailored for both novice users and seasoned professionals.
- Customizable Parameters: Effortlessly adjust inputs to suit your financial analysis.
- Real-Time Results: Instantly view changes to The San-in Godo Bank, Ltd.'s valuation as you modify inputs.
- Preloaded Data: Comes with The San-in Godo Bank, Ltd.'s actual financial figures for immediate evaluation.
- Endorsed by Experts: A go-to tool for investors and analysts in making well-informed decisions.
Who Can Benefit from This Service?
- Investors: Make informed decisions with the support of a high-quality valuation tool.
- Financial Analysts: Streamline your workflow with a ready-to-use DCF model that you can easily customize.
- Consultants: Swiftly modify the template for client meetings or reports.
- Finance Enthusiasts: Expand your knowledge of valuation methods through practical, real-life examples.
- Educators and Students: Utilize it as an effective learning resource in finance courses.
Discover the opportunities with The San-in Godo Bank, Ltd. (8381T).
Contents of the Template
- Pre-Filled DCF Model: Financial data for The San-in Godo Bank, Ltd. (8381T) preloaded for immediate utilization.
- WACC Calculator: Comprehensive calculations for the Weighted Average Cost of Capital.
- Financial Ratios: Assess The San-in Godo Bank's profitability, leverage, and operational efficiency.
- Editable Inputs: Adjust assumptions like growth rates, profit margins, and capital expenditures to suit your analysis.
- Financial Statements: Access annual and quarterly reports to facilitate in-depth evaluation.
- Interactive Dashboard: Visualize essential valuation metrics and outcomes with ease.
Disclaimer
All information, articles, and product details provided on this website are for general informational and educational purposes only. We do not claim any ownership over, nor do we intend to infringe upon, any trademarks, copyrights, logos, brand names, or other intellectual property mentioned or depicted on this site. Such intellectual property remains the property of its respective owners, and any references here are made solely for identification or informational purposes, without implying any affiliation, endorsement, or partnership.
We make no representations or warranties, express or implied, regarding the accuracy, completeness, or suitability of any content or products presented. Nothing on this website should be construed as legal, tax, investment, financial, medical, or other professional advice. In addition, no part of this site—including articles or product references—constitutes a solicitation, recommendation, endorsement, advertisement, or offer to buy or sell any securities, franchises, or other financial instruments, particularly in jurisdictions where such activity would be unlawful.
All content is of a general nature and may not address the specific circumstances of any individual or entity. It is not a substitute for professional advice or services. Any actions you take based on the information provided here are strictly at your own risk. You accept full responsibility for any decisions or outcomes arising from your use of this website and agree to release us from any liability in connection with your use of, or reliance upon, the content or products found herein.