
|
Aiful Corporation (8515.T) Valation DCF |
Entièrement Modifiable: Adapté À Vos Besoins Dans Excel Ou Sheets
Conception Professionnelle: Modèles Fiables Et Conformes Aux Normes Du Secteur
Pré-Construits Pour Une Utilisation Rapide Et Efficace
Compatible MAC/PC, entièrement débloqué
Aucune Expertise N'Est Requise; Facile À Suivre
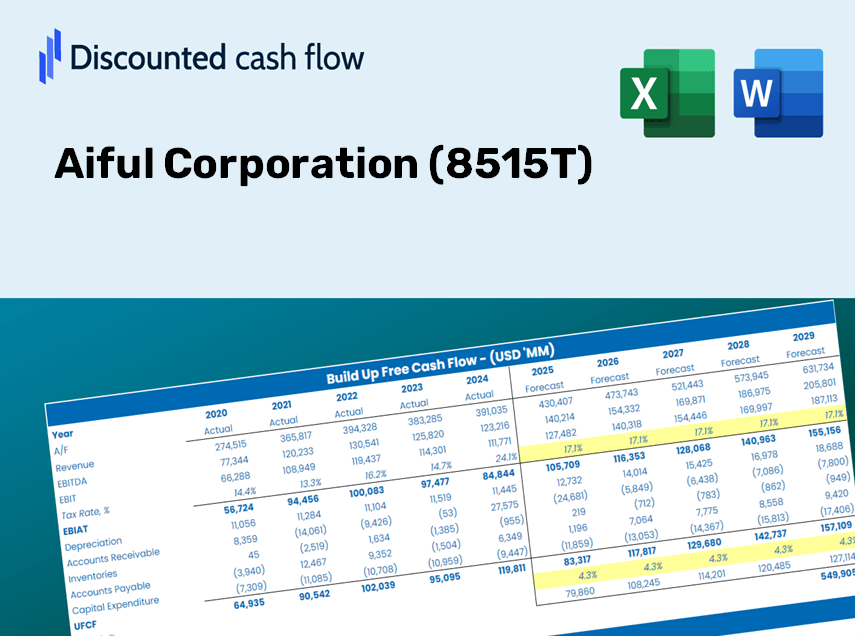
Aiful Corporation (8515.T) Bundle
En tant qu'investisseur ou analyste, cette calculatrice DCF de la société Aiful Corporation (8515T) est votre ressource incontournable pour une évaluation précise. Chargé de données réelles d'Aiful Corporation, vous pouvez ajuster les prévisions et observer les effets en temps réel.
Discounted Cash Flow (DCF) - (USD MM)
| Year | AY1 2021 |
AY2 2022 |
AY3 2023 |
AY4 2024 |
AY5 2025 |
FY1 2026 |
FY2 2027 |
FY3 2028 |
FY4 2029 |
FY5 2030 |
|---|---|---|---|---|---|---|---|---|---|---|
| Revenue | 127,478.0 | 132,094.0 | 144,148.0 | 163,107.0 | 189,050.0 | 208,807.8 | 230,630.4 | 254,733.8 | 281,356.2 | 310,760.9 |
| Revenue Growth, % | 0 | 3.62 | 9.13 | 13.15 | 15.91 | 10.45 | 10.45 | 10.45 | 10.45 | 10.45 |
| EBITDA | 27,874.0 | 14,656.0 | 27,321.0 | 24,977.0 | 31,515.0 | 35,037.0 | 38,698.7 | 42,743.2 | 47,210.3 | 52,144.3 |
| EBITDA, % | 21.87 | 11.1 | 18.95 | 15.31 | 16.67 | 16.78 | 16.78 | 16.78 | 16.78 | 16.78 |
| Depreciation | 3,418.0 | 3,417.0 | 3,599.0 | 3,913.0 | 5,122.0 | 5,376.0 | 5,937.9 | 6,558.5 | 7,243.9 | 8,000.9 |
| Depreciation, % | 2.68 | 2.59 | 2.5 | 2.4 | 2.71 | 2.57 | 2.57 | 2.57 | 2.57 | 2.57 |
| EBIT | 24,456.0 | 11,239.0 | 23,722.0 | 21,064.0 | 26,393.0 | 29,661.0 | 32,760.9 | 36,184.7 | 39,966.4 | 44,143.3 |
| EBIT, % | 19.18 | 8.51 | 16.46 | 12.91 | 13.96 | 14.2 | 14.2 | 14.2 | 14.2 | 14.2 |
| Total Cash | 40,950.0 | 46,760.0 | 43,251.0 | 56,917.0 | 60,608.0 | 68,690.0 | 75,868.9 | 83,798.0 | 92,555.8 | 102,228.9 |
| Total Cash, percent | .0 | .0 | .0 | .0 | .0 | .0 | .0 | .0 | .0 | .0 |
| Account Receivables | 573,481.0 | 617,686.0 | 710,458.0 | 885,270.0 | 941,567.0 | 208,807.8 | 230,630.4 | 254,733.8 | 281,356.2 | 310,760.9 |
| Account Receivables, % | 449.87 | 467.61 | 492.87 | 542.75 | 498.05 | 100 | 100 | 100 | 100 | 100 |
| Inventories | 47,751.0 | 45,353.0 | 47,315.0 | .0 | .0 | 43,689.3 | 48,255.3 | 53,298.5 | 58,868.7 | 65,021.1 |
| Inventories, % | 37.46 | 34.33 | 32.82 | 0 | 0 | 20.92 | 20.92 | 20.92 | 20.92 | 20.92 |
| Accounts Payable | 38,265.0 | 38,265.0 | 43,066.0 | 43,066.0 | 60,961.0 | 61,602.8 | 68,040.9 | 75,151.9 | 83,006.1 | 91,681.1 |
| Accounts Payable, % | 30.02 | 28.97 | 29.88 | 26.4 | 32.25 | 29.5 | 29.5 | 29.5 | 29.5 | 29.5 |
| Capital Expenditure | -4,603.0 | -3,520.0 | -4,483.0 | -10,102.0 | -18,189.0 | -10,524.0 | -11,623.9 | -12,838.8 | -14,180.5 | -15,662.6 |
| Capital Expenditure, % | -3.61 | -2.66 | -3.11 | -6.19 | -9.62 | -5.04 | -5.04 | -5.04 | -5.04 | -5.04 |
| Tax Rate, % | 7.11 | 7.11 | 7.11 | 7.11 | 7.11 | 7.11 | 7.11 | 7.11 | 7.11 | 7.11 |
| EBITAT | 24,844.1 | 11,302.2 | 22,122.0 | 21,382.5 | 24,515.9 | 28,838.9 | 31,852.9 | 35,181.9 | 38,858.8 | 42,919.9 |
| Depreciation | ||||||||||
| Changes in Account Receivables | ||||||||||
| Changes in Inventories | ||||||||||
| Changes in Accounts Payable | ||||||||||
| Capital Expenditure | ||||||||||
| UFCF | -559,307.9 | -30,607.8 | -68,695.0 | -112,303.5 | -26,953.1 | 713,402.6 | 6,216.4 | 6,866.1 | 7,583.6 | 8,376.2 |
| WACC, % | 3.8 | 3.8 | 3.61 | 3.8 | 3.6 | 3.72 | 3.72 | 3.72 | 3.72 | 3.72 |
| PV UFCF | ||||||||||
| SUM PV UFCF | 713,269.5 | |||||||||
| Long Term Growth Rate, % | 2.00 | |||||||||
| Free cash flow (T + 1) | 8,544 | |||||||||
| Terminal Value | 496,377 | |||||||||
| Present Terminal Value | 413,498 | |||||||||
| Enterprise Value | 1,126,767 | |||||||||
| Net Debt | 729,008 | |||||||||
| Equity Value | 397,759 | |||||||||
| Diluted Shares Outstanding, MM | 480 | |||||||||
| Equity Value Per Share | 828.75 |
What You Will Receive
- Authentic Aiful Financials: Access to both historical and projected data for precise valuation.
- Customizable Inputs: Adjust parameters such as WACC, tax rates, revenue growth, and capital expenditures.
- Instant Calculations: Intrinsic value and NPV are calculated in real-time.
- Scenario Evaluation: Explore various scenarios to assess Aiful’s potential performance.
- User-Friendly Interface: Designed for industry professionals while remaining easy for newcomers.
Key Features
- Customizable Forecast Inputs: Adjust essential parameters such as revenue growth, EBITDA percentages, and capital investments.
- Instant DCF Valuation: Quickly computes intrinsic value, NPV, and various other financial metrics.
- High-Precision Accuracy: Leverages Aiful Corporation's real-world financial data for trustworthy valuation results.
- Simplified Scenario Analysis: Effortlessly explore different assumptions and evaluate their impacts.
- Efficiency Booster: Streamlines the process, removing the necessity of creating intricate valuation models from the ground up.
Understanding the Process
- Download the Template: Gain immediate access to the Excel-based Aiful Corporation (8515T) DCF Calculator.
- Input Your Assumptions: Modify the yellow-highlighted cells for growth rates, WACC, margins, and additional variables.
- Instant Calculations: The model promptly updates the intrinsic value of Aiful Corporation (8515T).
- Test Scenarios: Explore various assumptions to assess potential changes in valuation.
- Analyze and Decide: Leverage the results to inform your investment or financial analysis.
Why Choose This Calculator for Aiful Corporation (8515T)?
- Reliable Data: Access authentic financials for Aiful Corporation to ensure accurate valuation outcomes.
- Flexible: Modify essential parameters, including growth rates, WACC, and tax rates to align with your financial forecasts.
- Efficient: Pre-configured calculations save you time by eliminating the need to begin from the ground up.
- Professional-Quality Tool: Crafted for investors, analysts, and financial consultants focusing on Aiful Corporation (8515T).
- User-Friendly: With an intuitive interface and clear step-by-step guidance, it’s accessible for everyone.
Who Should Benefit from Aiful Corporation (8515T)?
- Professional Investors: Develop comprehensive and trustworthy valuation models for portfolio management.
- Corporate Finance Teams: Evaluate valuation scenarios to inform strategic decision-making.
- Consultants and Advisors: Deliver precise valuation insights for clients interested in Aiful Corporation (8515T).
- Students and Educators: Utilize real-world data to enhance financial modeling skills and education.
- Finance Enthusiasts: Gain insight into how Aiful Corporation (8515T) is appraised within the market.
Contents of the Template
- Operating and Balance Sheet Data: Pre-filled historical data and forecasts for Aiful Corporation (8515T), including revenue, EBITDA, EBIT, and capital expenditures.
- WACC Calculation: A dedicated sheet for Weighted Average Cost of Capital (WACC), featuring parameters such as Beta, risk-free rate, and share price.
- DCF Valuation (Unlevered and Levered): Editable Discounted Cash Flow models displaying intrinsic value with comprehensive calculations.
- Financial Statements: Pre-loaded financial statements (annual and quarterly) to facilitate analysis.
- Key Ratios: Includes important profitability, leverage, and efficiency ratios for Aiful Corporation (8515T).
- Dashboard and Charts: A visual summary of valuation outputs and assumptions for easy result analysis.
Disclaimer
All information, articles, and product details provided on this website are for general informational and educational purposes only. We do not claim any ownership over, nor do we intend to infringe upon, any trademarks, copyrights, logos, brand names, or other intellectual property mentioned or depicted on this site. Such intellectual property remains the property of its respective owners, and any references here are made solely for identification or informational purposes, without implying any affiliation, endorsement, or partnership.
We make no representations or warranties, express or implied, regarding the accuracy, completeness, or suitability of any content or products presented. Nothing on this website should be construed as legal, tax, investment, financial, medical, or other professional advice. In addition, no part of this site—including articles or product references—constitutes a solicitation, recommendation, endorsement, advertisement, or offer to buy or sell any securities, franchises, or other financial instruments, particularly in jurisdictions where such activity would be unlawful.
All content is of a general nature and may not address the specific circumstances of any individual or entity. It is not a substitute for professional advice or services. Any actions you take based on the information provided here are strictly at your own risk. You accept full responsibility for any decisions or outcomes arising from your use of this website and agree to release us from any liability in connection with your use of, or reliance upon, the content or products found herein.