
|
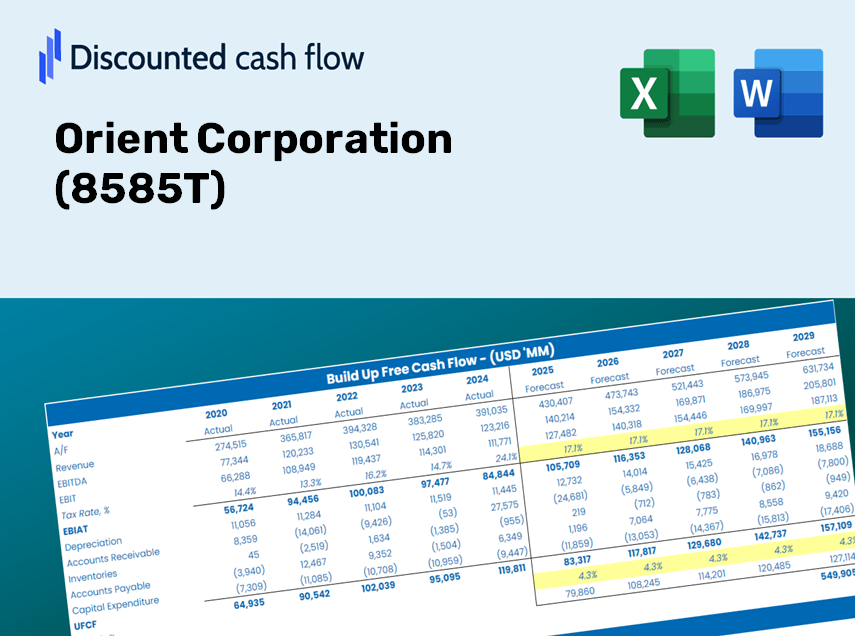
Orient Corporation (8585.T) Évaluation DCF |
Entièrement Modifiable: Adapté À Vos Besoins Dans Excel Ou Sheets
Conception Professionnelle: Modèles Fiables Et Conformes Aux Normes Du Secteur
Pré-Construits Pour Une Utilisation Rapide Et Efficace
Compatible MAC/PC, entièrement débloqué
Aucune Expertise N'Est Requise; Facile À Suivre
Orient Corporation (8585.T) Bundle
Conçu pour la précision, notre (8585T) Calculator DCF vous permet d'évaluer l'évaluation d'Orient Corporation à l'aide de données financières du monde réel, offrant une flexibilité complète pour modifier tous les paramètres clés pour l'amélioration des projections.
Discounted Cash Flow (DCF) - (USD MM)
| Year | AY1 2020 |
AY2 2021 |
AY3 2022 |
AY4 2023 |
AY5 2024 |
FY1 2025 |
FY2 2026 |
FY3 2027 |
FY4 2028 |
FY5 2029 |
|---|---|---|---|---|---|---|---|---|---|---|
| Revenue | 230,594.0 | 229,804.0 | 227,691.0 | 229,053.0 | 245,269.0 | 249,202.9 | 253,199.9 | 257,261.1 | 261,387.3 | 265,579.8 |
| Revenue Growth, % | 0 | -0.34259 | -0.91948 | 0.59818 | 7.08 | 1.6 | 1.6 | 1.6 | 1.6 | 1.6 |
| EBITDA | 44,718.0 | 54,401.0 | 49,620.0 | 38,014.0 | 54,256.0 | 51,622.5 | 52,450.5 | 53,291.7 | 54,146.5 | 55,014.9 |
| EBITDA, % | 19.39 | 23.67 | 21.79 | 16.6 | 22.12 | 20.72 | 20.72 | 20.72 | 20.72 | 20.72 |
| Depreciation | 23,909.0 | 25,406.0 | 26,550.0 | 21,895.0 | 20,518.0 | 25,423.1 | 25,830.9 | 26,245.2 | 26,666.2 | 27,093.9 |
| Depreciation, % | 10.37 | 11.06 | 11.66 | 9.56 | 8.37 | 10.2 | 10.2 | 10.2 | 10.2 | 10.2 |
| EBIT | 20,809.0 | 28,995.0 | 23,070.0 | 16,119.0 | 33,738.0 | 26,199.3 | 26,619.5 | 27,046.5 | 27,480.3 | 27,921.1 |
| EBIT, % | 9.02 | 12.62 | 10.13 | 7.04 | 13.76 | 10.51 | 10.51 | 10.51 | 10.51 | 10.51 |
| Total Cash | 315,176.0 | 218,189.0 | 219,845.0 | 479,360.0 | 216,805.0 | 239,182.3 | 243,018.6 | 246,916.4 | 250,876.7 | 254,900.6 |
| Total Cash, percent | .0 | .0 | .0 | .0 | .0 | .0 | .0 | .0 | .0 | .0 |
| Account Receivables | 4,195,552.0 | 2,950,235.0 | 2,951,299.0 | 2,235,923.0 | 2,252,886.0 | 249,202.9 | 253,199.9 | 257,261.1 | 261,387.3 | 265,579.8 |
| Account Receivables, % | 1819.45 | 1283.8 | 1296.19 | 976.16 | 918.54 | 100 | 100 | 100 | 100 | 100 |
| Inventories | 704.0 | 2,765.0 | -477,561.0 | .0 | .0 | -49,088.7 | -49,876.1 | -50,676.1 | -51,488.9 | -52,314.7 |
| Inventories, % | 0.3053 | 1.2 | -209.74 | 0 | 0 | -19.7 | -19.7 | -19.7 | -19.7 | -19.7 |
| Accounts Payable | 1,457,321.0 | 1,415,471.0 | 122,725.0 | 187,598.0 | 168,282.0 | 201,561.6 | 204,794.5 | 208,079.2 | 211,416.7 | 214,807.6 |
| Accounts Payable, % | 631.99 | 615.95 | 53.9 | 81.9 | 68.61 | 80.88 | 80.88 | 80.88 | 80.88 | 80.88 |
| Capital Expenditure | -12,836.0 | -12,752.0 | -13,135.0 | -13,664.0 | -14,821.0 | -14,400.2 | -14,631.2 | -14,865.9 | -15,104.3 | -15,346.5 |
| Capital Expenditure, % | -5.57 | -5.55 | -5.77 | -5.97 | -6.04 | -5.78 | -5.78 | -5.78 | -5.78 | -5.78 |
| Tax Rate, % | 39.7 | 39.7 | 39.7 | 39.7 | 39.7 | 39.7 | 39.7 | 39.7 | 39.7 | 39.7 |
| EBITAT | 17,408.6 | 19,224.1 | 18,385.5 | 11,234.9 | 20,342.9 | 18,845.2 | 19,147.5 | 19,454.6 | 19,766.6 | 20,083.7 |
| Depreciation | ||||||||||
| Changes in Account Receivables | ||||||||||
| Changes in Inventories | ||||||||||
| Changes in Accounts Payable | ||||||||||
| Capital Expenditure | ||||||||||
| UFCF | -2,710,453.4 | 1,233,284.1 | -781,683.5 | 322,153.9 | -10,239.1 | 2,115,919.6 | 30,370.4 | 30,857.5 | 31,352.5 | 31,855.4 |
| WACC, % | 3.31 | 2.73 | 3.18 | 2.84 | 2.53 | 2.92 | 2.92 | 2.92 | 2.92 | 2.92 |
| PV UFCF | ||||||||||
| SUM PV UFCF | 2,168,479.5 | |||||||||
| Long Term Growth Rate, % | 2.00 | |||||||||
| Free cash flow (T + 1) | 32,492 | |||||||||
| Terminal Value | 3,545,840 | |||||||||
| Present Terminal Value | 3,071,123 | |||||||||
| Enterprise Value | 5,239,603 | |||||||||
| Net Debt | 1,916,063 | |||||||||
| Equity Value | 3,323,540 | |||||||||
| Diluted Shares Outstanding, MM | 171 | |||||||||
| Equity Value Per Share | 19,413.77 |
What You Will Receive
- Authentic Orient Corporation Financial Data: Pre-loaded with historical and forecasted figures for precise analysis.
- Completely Customizable Template: Easily adjust essential inputs such as revenue growth, WACC, and EBITDA percentage.
- Instantaneous Calculations: Witness the intrinsic value of Orient Corporation update in real-time as you make changes.
- Expert Valuation Tool: Tailored for investors, analysts, and consultants in search of reliable DCF results.
- User-Centric Design: A straightforward layout with clear guidance suitable for all skill levels.
Key Features of Orient Corporation (8585T)
- Accurate Historical Financials: Gain access to reliable, pre-loaded historical data and projected future performance.
- Adjustable Forecast Parameters: Modify key inputs highlighted in yellow, such as WACC, growth rates, and profit margins.
- Automatic Calculations: Enjoy immediate updates for DCF, Net Present Value (NPV), and cash flow assessments.
- User-Friendly Dashboard: Intuitive charts and summaries that effectively present your valuation outcomes.
- Designed for All Skill Levels: A straightforward and accessible layout tailored for investors, CFOs, and consultants alike.
How It Functions
- Step 1: Download the Excel spreadsheet.
- Step 2: Examine Orient Corporation’s pre-filled financial data and forecasts.
- Step 3: Adjust key parameters such as revenue growth, WACC, and tax rates (highlighted cells).
- Step 4: Observe the DCF model refresh in real-time as you modify your inputs.
- Step 5: Evaluate the results and utilize them for your investment strategies.
Why Opt for This Calculator?
- All-in-One Solution: Combines DCF, WACC, and financial ratio analysis for comprehensive insights.
- Flexible Inputs: Modify the highlighted cells to explore different scenarios and outcomes.
- In-Depth Analysis: Automatically computes Orient Corporation’s intrinsic value and Net Present Value.
- Preloaded Information: Comes with historical and projected data for a solid foundation.
- High-Quality Standards: Perfectly suited for financial professionals, investors, and business advisors.
Who Can Benefit from This Product?
- Professional Investors: Develop comprehensive and trustworthy valuation models for in-depth portfolio assessments.
- Corporate Finance Teams: Evaluate valuation scenarios to inform and shape internal strategies.
- Consultants and Advisors: Deliver precise valuation insights for Orient Corporation (8585T) to clients.
- Students and Educators: Leverage real-world data for practical applications and financial modeling education.
- Tech Enthusiasts: Gain insights into the market valuation of technology firms like Orient Corporation (8585T).
Contents of the Template
- Pre-Filled Data: Contains Orient Corporation’s historical financial performance and forecasts.
- Discounted Cash Flow Model: An editable DCF valuation model featuring automatic calculations.
- Weighted Average Cost of Capital (WACC): A dedicated worksheet for calculating WACC using user-defined inputs.
- Key Financial Ratios: Assess Orient Corporation's profitability, efficiency, and financial leverage.
- Customizable Inputs: Easily modify revenue growth, profit margins, and tax rates.
- Clear Dashboard: Visual summaries, including charts and tables that highlight key valuation outcomes.
Disclaimer
All information, articles, and product details provided on this website are for general informational and educational purposes only. We do not claim any ownership over, nor do we intend to infringe upon, any trademarks, copyrights, logos, brand names, or other intellectual property mentioned or depicted on this site. Such intellectual property remains the property of its respective owners, and any references here are made solely for identification or informational purposes, without implying any affiliation, endorsement, or partnership.
We make no representations or warranties, express or implied, regarding the accuracy, completeness, or suitability of any content or products presented. Nothing on this website should be construed as legal, tax, investment, financial, medical, or other professional advice. In addition, no part of this site—including articles or product references—constitutes a solicitation, recommendation, endorsement, advertisement, or offer to buy or sell any securities, franchises, or other financial instruments, particularly in jurisdictions where such activity would be unlawful.
All content is of a general nature and may not address the specific circumstances of any individual or entity. It is not a substitute for professional advice or services. Any actions you take based on the information provided here are strictly at your own risk. You accept full responsibility for any decisions or outcomes arising from your use of this website and agree to release us from any liability in connection with your use of, or reliance upon, the content or products found herein.