
|
JAFCO Group Co., Ltd. (8595.T) Évaluation DCF |
Entièrement Modifiable: Adapté À Vos Besoins Dans Excel Ou Sheets
Conception Professionnelle: Modèles Fiables Et Conformes Aux Normes Du Secteur
Pré-Construits Pour Une Utilisation Rapide Et Efficace
Compatible MAC/PC, entièrement débloqué
Aucune Expertise N'Est Requise; Facile À Suivre
JAFCO Group Co., Ltd. (8595.T) Bundle
Que vous soyez un investisseur ou un analyste, cette (8595T) Calculator DCF est votre outil ultime pour une évaluation précise. Préchargé avec JAFCO Group Co., Ltd. Données réelles, vous pouvez ajuster les prévisions et voir les effets en temps réel.
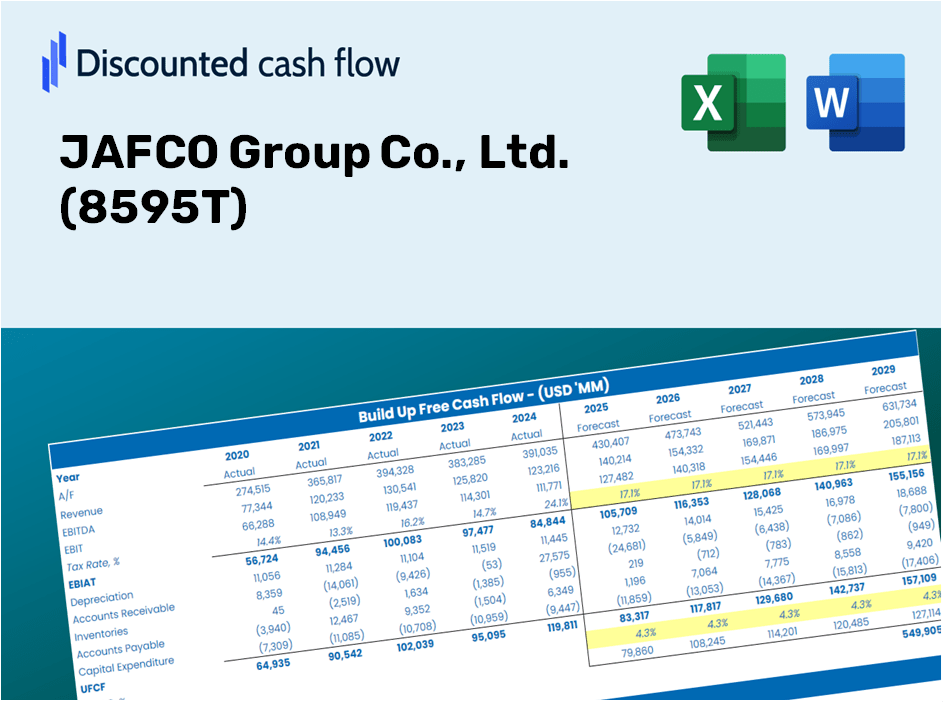
Discounted Cash Flow (DCF) - (USD MM)
| Year | AY1 2020 |
AY2 2021 |
AY3 2022 |
AY4 2023 |
AY5 2024 |
FY1 2025 |
FY2 2026 |
FY3 2027 |
FY4 2028 |
FY5 2029 |
|---|---|---|---|---|---|---|---|---|---|---|
| Revenue | 21,510.0 | 27,676.0 | 14,071.0 | 24,442.0 | 29,682.0 | 35,221.5 | 41,794.8 | 49,594.8 | 58,850.5 | 69,833.7 |
| Revenue Growth, % | 0 | 28.67 | -49.16 | 73.7 | 21.44 | 18.66 | 18.66 | 18.66 | 18.66 | 18.66 |
| EBITDA | 56,664.0 | 15,281.0 | 59,321.0 | 8,355.0 | 12,661.0 | 23,390.7 | 27,756.1 | 32,936.1 | 39,082.9 | 46,376.9 |
| EBITDA, % | 263.43 | 55.21 | 421.58 | 34.18 | 42.66 | 66.41 | 66.41 | 66.41 | 66.41 | 66.41 |
| Depreciation | 192.0 | 205.0 | 208.0 | 181.0 | 148.0 | 306.5 | 363.7 | 431.5 | 512.1 | 607.6 |
| Depreciation, % | 0.89261 | 0.74071 | 1.48 | 0.74053 | 0.49862 | 0.87014 | 0.87014 | 0.87014 | 0.87014 | 0.87014 |
| EBIT | 56,472.0 | 15,076.0 | 59,113.0 | 8,174.0 | 12,513.0 | 23,251.3 | 27,590.6 | 32,739.8 | 38,849.9 | 46,100.3 |
| EBIT, % | 262.54 | 54.47 | 420.11 | 33.44 | 42.16 | 66.01 | 66.01 | 66.01 | 66.01 | 66.01 |
| Total Cash | 107,517.0 | 52,603.0 | 69,481.0 | 67,606.0 | 163,865.0 | 35,221.5 | 41,794.8 | 49,594.8 | 58,850.5 | 69,833.7 |
| Total Cash, percent | .0 | .0 | .0 | .0 | .0 | .0 | .0 | .0 | .0 | .0 |
| Account Receivables | 162.0 | 79,211.0 | 84,040.0 | 90,167.0 | 264.0 | 21,248.6 | 25,214.2 | 29,919.8 | 35,503.7 | 42,129.6 |
| Account Receivables, % | 0.75314 | 286.21 | 597.26 | 368.9 | 0.88943 | 60.33 | 60.33 | 60.33 | 60.33 | 60.33 |
| Inventories | -68,630.0 | -79,211.0 | -84,040.0 | .0 | .0 | -21,132.9 | -25,076.9 | -29,756.9 | -35,310.3 | -41,900.2 |
| Inventories, % | -319.06 | -286.21 | -597.26 | 0 | 0 | -60 | -60 | -60 | -60 | -60 |
| Accounts Payable | .0 | .0 | .0 | .0 | .0 | .0 | .0 | .0 | .0 | .0 |
| Accounts Payable, % | 0 | 0 | 0 | 0 | 0 | 0 | 0 | 0 | 0 | 0 |
| Capital Expenditure | -127.0 | -76.0 | -39.0 | -303.0 | -23.0 | -173.2 | -205.6 | -243.9 | -289.5 | -343.5 |
| Capital Expenditure, % | -0.59042 | -0.27461 | -0.27717 | -1.24 | -0.07748804 | -0.49187 | -0.49187 | -0.49187 | -0.49187 | -0.49187 |
| Tax Rate, % | 27.48 | 27.48 | 27.48 | 27.48 | 27.48 | 27.48 | 27.48 | 27.48 | 27.48 | 27.48 |
| EBITAT | 38,504.7 | 12,257.8 | 39,080.2 | 6,943.5 | 9,074.2 | 17,348.5 | 20,586.2 | 24,428.2 | 28,987.2 | 34,397.0 |
| Depreciation | ||||||||||
| Changes in Account Receivables | ||||||||||
| Changes in Inventories | ||||||||||
| Changes in Accounts Payable | ||||||||||
| Capital Expenditure | ||||||||||
| UFCF | 107,037.7 | -56,081.2 | 39,249.2 | -83,345.5 | 99,102.2 | 17,630.1 | 20,722.7 | 24,590.2 | 29,179.4 | 34,625.0 |
| WACC, % | 4.88 | 4.92 | 4.87 | 4.94 | 4.89 | 4.9 | 4.9 | 4.9 | 4.9 | 4.9 |
| PV UFCF | ||||||||||
| SUM PV UFCF | 108,298.1 | |||||||||
| Long Term Growth Rate, % | 2.00 | |||||||||
| Free cash flow (T + 1) | 35,318 | |||||||||
| Terminal Value | 1,217,852 | |||||||||
| Present Terminal Value | 958,776 | |||||||||
| Enterprise Value | 1,067,074 | |||||||||
| Net Debt | -57,303 | |||||||||
| Equity Value | 1,124,377 | |||||||||
| Diluted Shares Outstanding, MM | 55 | |||||||||
| Equity Value Per Share | 20,616.39 |
What You'll Receive
- Comprehensive JAFCO Financial Data: Pre-loaded with historical and projected figures for detailed analysis.
- Customizable Template: Easily adjust key metrics like revenue growth, WACC, and EBITDA percentage.
- Instant Calculations: Watch the intrinsic value of JAFCO update in real-time as you make adjustments.
- Expert Valuation Tool: Tailored for investors, analysts, and consultants aiming for precise DCF evaluations.
- Intuitive Layout: Clear structure and straightforward guidance suitable for all skill levels.
Key Features
- Comprehensive DCF Analyzer: Offers detailed unlevered and levered DCF valuation frameworks tailored for JAFCO Group Co., Ltd. (8595T).
- WACC Estimation Tool: Features a pre-configured Weighted Average Cost of Capital calculator with adjustable parameters.
- Customizable Forecast Inputs: Easily adjust growth projections, capital expenditures, and discount rates.
- Integrated Financial Ratios: Evaluate profitability, leverage, and operational efficiency ratios specifically for JAFCO Group Co., Ltd. (8595T).
- Analysis Dashboard and Visualizations: Generative charts provide a clear summary of essential valuation metrics for streamlined evaluation.
How It Functions
- Step 1: Download the Excel spreadsheet.
- Step 2: Examine JAFCO Group Co., Ltd.'s (8595T) pre-filled financial information and projections.
- Step 3: Adjust key inputs such as revenue growth, WACC, and tax rates (highlighted cells).
- Step 4: Observe the DCF model refresh in real-time as you alter your assumptions.
- Step 5: Evaluate the results and utilize them for investment choices.
Why Opt for This Calculator?
- Designed for Experts: A sophisticated tool tailored for analysts, CFOs, and consultants.
- Accurate Data: JAFCO Group Co., Ltd.'s historical and projected financials preloaded for precision.
- Scenario Analysis: Effortlessly simulate various forecasts and assumptions.
- Transparent Results: Automatically computes intrinsic value, NPV, and essential metrics.
- User-Friendly: Step-by-step guidance simplifies the process for you.
Who Should Utilize This Product?
- Investors: Accurately assess JAFCO Group Co., Ltd.'s (8595T) fair value prior to making investment choices.
- CFOs: Utilize a top-tier DCF model for financial analysis and reporting.
- Consultants: Seamlessly customize the template for client valuation reports.
- Entrepreneurs: Acquire insights into financial modeling practices employed by industry leaders.
- Educators: Employ it as a pedagogical resource to illustrate valuation techniques.
Overview of Template Features
- Pre-Filled DCF Model: JAFCO Group Co., Ltd.'s (8595T) financial data preloaded for immediate analysis.
- WACC Calculator: Comprehensive calculations for Weighted Average Cost of Capital.
- Financial Ratios: Assess JAFCO Group’s (8595T) profitability, leverage, and operational efficiency.
- Editable Inputs: Modify assumptions such as growth rates, profit margins, and capital expenditures to suit your scenarios.
- Financial Statements: Access annual and quarterly reports for in-depth analysis.
- Interactive Dashboard: Visualize essential valuation metrics and outcomes with ease.
Disclaimer
All information, articles, and product details provided on this website are for general informational and educational purposes only. We do not claim any ownership over, nor do we intend to infringe upon, any trademarks, copyrights, logos, brand names, or other intellectual property mentioned or depicted on this site. Such intellectual property remains the property of its respective owners, and any references here are made solely for identification or informational purposes, without implying any affiliation, endorsement, or partnership.
We make no representations or warranties, express or implied, regarding the accuracy, completeness, or suitability of any content or products presented. Nothing on this website should be construed as legal, tax, investment, financial, medical, or other professional advice. In addition, no part of this site—including articles or product references—constitutes a solicitation, recommendation, endorsement, advertisement, or offer to buy or sell any securities, franchises, or other financial instruments, particularly in jurisdictions where such activity would be unlawful.
All content is of a general nature and may not address the specific circumstances of any individual or entity. It is not a substitute for professional advice or services. Any actions you take based on the information provided here are strictly at your own risk. You accept full responsibility for any decisions or outcomes arising from your use of this website and agree to release us from any liability in connection with your use of, or reliance upon, the content or products found herein.