
|
T&D Holdings, Inc. (8795.T) Évaluation DCF |
Entièrement Modifiable: Adapté À Vos Besoins Dans Excel Ou Sheets
Conception Professionnelle: Modèles Fiables Et Conformes Aux Normes Du Secteur
Pré-Construits Pour Une Utilisation Rapide Et Efficace
Compatible MAC/PC, entièrement débloqué
Aucune Expertise N'Est Requise; Facile À Suivre
T&D Holdings, Inc. (8795.T) Bundle
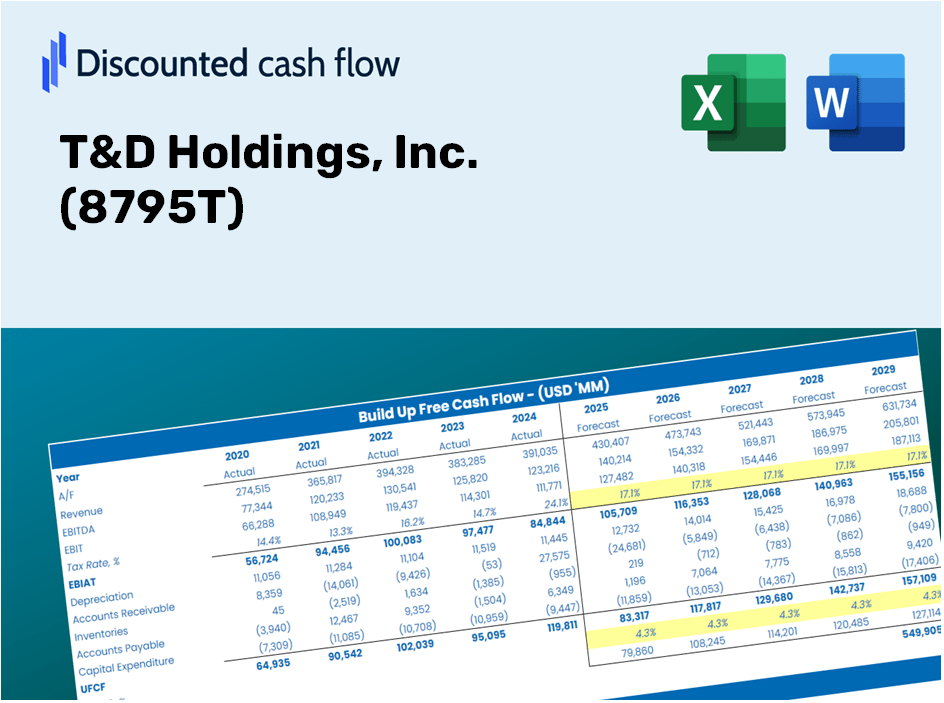
Gardez un aperçu de votre analyse d'évaluation T&D Holdings, Inc. (8795T) avec notre calculatrice sophistiquée DCF! Ce modèle Excel est préchargé avec des données réelles (8795T), vous permettant d'ajuster les prévisions et les hypothèses pour déterminer la valeur intrinsèque de T&D Holdings, Inc. avec précision.
Discounted Cash Flow (DCF) - (USD MM)
| Year | AY1 2021 |
AY2 2022 |
AY3 2023 |
AY4 2024 |
AY5 2025 |
FY1 2026 |
FY2 2027 |
FY3 2028 |
FY4 2029 |
FY5 2030 |
|---|---|---|---|---|---|---|---|---|---|---|
| Revenue | 2,122,533.0 | 1,702,158.0 | 2,126,809.0 | 2,303,873.0 | 2,338,228.0 | 2,425,671.7 | 2,516,385.7 | 2,610,492.0 | 2,708,117.8 | 2,809,394.4 |
| Revenue Growth, % | 0 | -19.81 | 24.95 | 8.33 | 1.49 | 3.74 | 3.74 | 3.74 | 3.74 | 3.74 |
| EBITDA | 159,022.0 | 44,824.0 | -81,065.0 | 157,541.0 | 192,984.0 | 103,844.9 | 107,728.5 | 111,757.2 | 115,936.7 | 120,272.4 |
| EBITDA, % | 7.49 | 2.63 | -3.81 | 6.84 | 8.25 | 4.28 | 4.28 | 4.28 | 4.28 | 4.28 |
| Depreciation | 19,841.0 | 20,206.0 | 21,184.0 | 21,027.0 | 21,886.0 | 24,094.7 | 24,995.7 | 25,930.5 | 26,900.3 | 27,906.3 |
| Depreciation, % | 0.93478 | 1.19 | 0.99605 | 0.91268 | 0.93601 | 0.99332 | 0.99332 | 0.99332 | 0.99332 | 0.99332 |
| EBIT | 139,181.0 | 24,618.0 | -102,249.0 | 136,514.0 | 171,098.0 | 79,750.3 | 82,732.7 | 85,826.7 | 89,036.4 | 92,366.1 |
| EBIT, % | 6.56 | 1.45 | -4.81 | 5.93 | 7.32 | 3.29 | 3.29 | 3.29 | 3.29 | 3.29 |
| Total Cash | 1,020,246.0 | 890,674.0 | 1,140,802.0 | 1,137,609.0 | 778,681.0 | 1,148,376.0 | 1,191,322.3 | 1,235,874.7 | 1,282,093.2 | 1,330,040.3 |
| Total Cash, percent | .0 | .0 | .0 | .0 | .0 | .0 | .0 | .0 | .0 | .0 |
| Account Receivables | .0 | 34,694.0 | 44,928.0 | 79,240.0 | 60,860.0 | 49,449.5 | 51,298.8 | 53,217.2 | 55,207.4 | 57,272.0 |
| Account Receivables, % | 0 | 2.04 | 2.11 | 3.44 | 2.6 | 2.04 | 2.04 | 2.04 | 2.04 | 2.04 |
| Inventories | .0 | .0 | .0 | .0 | .0 | .0 | .0 | .0 | .0 | .0 |
| Inventories, % | 0 | 0 | 0 | 0 | 0 | 0 | 0 | 0 | 0 | 0 |
| Accounts Payable | 14,831.0 | 15,593.0 | 29,960.0 | 31,141.0 | 43,448.0 | 30,240.1 | 31,371.0 | 32,544.1 | 33,761.2 | 35,023.8 |
| Accounts Payable, % | 0.69874 | 0.91607 | 1.41 | 1.35 | 1.86 | 1.25 | 1.25 | 1.25 | 1.25 | 1.25 |
| Capital Expenditure | -11,082.0 | -7,989.0 | -22,291.0 | -15,507.0 | -19,598.0 | -17,226.1 | -17,870.3 | -18,538.6 | -19,231.9 | -19,951.2 |
| Capital Expenditure, % | -0.52211 | -0.46935 | -1.05 | -0.67308 | -0.83816 | -0.71016 | -0.71016 | -0.71016 | -0.71016 | -0.71016 |
| Tax Rate, % | 25.07 | 25.07 | 25.07 | 25.07 | 25.07 | 25.07 | 25.07 | 25.07 | 25.07 | 25.07 |
| EBITAT | 109,736.5 | 15,225.2 | -129,960.0 | 99,825.6 | 128,211.7 | 62,005.8 | 64,324.6 | 66,730.2 | 69,225.7 | 71,814.6 |
| Depreciation | ||||||||||
| Changes in Account Receivables | ||||||||||
| Changes in Inventories | ||||||||||
| Changes in Accounts Payable | ||||||||||
| Capital Expenditure | ||||||||||
| UFCF | 133,326.5 | -6,489.8 | -126,934.0 | 72,214.6 | 161,186.7 | 67,076.9 | 70,731.7 | 73,376.8 | 76,120.9 | 78,967.7 |
| WACC, % | 6.08 | 6.02 | 6.16 | 6.06 | 6.07 | 6.08 | 6.08 | 6.08 | 6.08 | 6.08 |
| PV UFCF | ||||||||||
| SUM PV UFCF | 306,454.7 | |||||||||
| Long Term Growth Rate, % | 2.00 | |||||||||
| Free cash flow (T + 1) | 80,547 | |||||||||
| Terminal Value | 1,974,007 | |||||||||
| Present Terminal Value | 1,469,512 | |||||||||
| Enterprise Value | 1,775,967 | |||||||||
| Net Debt | -650,692 | |||||||||
| Equity Value | 2,426,659 | |||||||||
| Diluted Shares Outstanding, MM | 523 | |||||||||
| Equity Value Per Share | 4,637.90 |
Benefits You Will Receive
- Authentic T&D Holdings Financials: Access to comprehensive historical and projected data for precise valuation.
- Customizable Inputs: Adjust metrics such as WACC, tax rates, revenue growth, and capital expenditures.
- Automated Calculations: Dynamic computations of intrinsic value and NPV.
- Scenario Analysis: Explore various scenarios to assess T&D Holdings' future performance.
- User-Friendly Design: Crafted for professionals while remaining accessible to novices.
Key Features
- Comprehensive T&D Data: Includes T&D Holdings’ historical financials alongside future projections tailored for (8795T).
- Customizable Assumptions: Modify inputs such as revenue growth, profit margins, WACC, tax rates, and capital expenditures to suit your analysis.
- Interactive Valuation Tool: Automatically refreshes Net Present Value (NPV) and intrinsic value calculations based on user-defined parameters.
- Scenario Analysis: Develop various forecast scenarios to explore diverse valuation possibilities for (8795T).
- Intuitive Interface: Designed for ease of use, making it accessible for both seasoned professionals and newcomers.
How It Functions
- 1. Access the Template: Download and open the Excel file containing T&D Holdings, Inc. (8795T) preloaded data.
- 2. Modify Assumptions: Adjust essential inputs such as growth rates, WACC, and capital expenditures.
- 3. View Immediate Results: The DCF model automatically computes intrinsic value and NPV based on your inputs.
- 4. Experiment with Scenarios: Evaluate various forecasts to explore different valuation results.
- 5. Utilize with Assurance: Present professional valuation findings to back your strategic decisions.
Why Choose This Calculator for T&D Holdings, Inc. (8795T)?
- Designed for Experts: A sophisticated tool tailored for analysts, CFOs, and consultants.
- Comprehensive Data: T&D Holdings' historical and projected financial data is preloaded for precise analysis.
- Flexible Scenario Analysis: Effortlessly simulate various forecasts and assumptions.
- Clear Results: Automatically computes intrinsic value, NPV, and essential financial metrics.
- User-Friendly: Detailed step-by-step instructions to guide you through the calculations.
Who Can Benefit from This Product?
- Investors: Evaluate T&D Holdings, Inc.'s (8795T) valuation before making investment decisions.
- CFOs and Financial Analysts: Optimize valuation workflows and validate financial forecasts.
- Startup Founders: Discover how established companies like T&D Holdings, Inc. (8795T) are appraised.
- Consultants: Prepare comprehensive valuation reports for your clientele.
- Students and Educators: Utilize real-time data to learn and teach valuation methodologies.
What the Template Contains
- Operating and Balance Sheet Data: Pre-filled historical data and forecasts for T&D Holdings, Inc. (8795T), including revenue, EBITDA, EBIT, and capital expenditures.
- WACC Calculation: A specialized sheet for Weighted Average Cost of Capital (WACC), featuring parameters such as Beta, risk-free rate, and share price.
- DCF Valuation (Unlevered and Levered): Customizable Discounted Cash Flow models presenting intrinsic value with comprehensive calculations.
- Financial Statements: Pre-loaded annual and quarterly financial statements to facilitate analysis.
- Key Ratios: Contains profitability, leverage, and efficiency ratios for T&D Holdings, Inc. (8795T).
- Dashboard and Charts: Visual summary of valuation outputs and assumptions for easy result analysis.
Disclaimer
All information, articles, and product details provided on this website are for general informational and educational purposes only. We do not claim any ownership over, nor do we intend to infringe upon, any trademarks, copyrights, logos, brand names, or other intellectual property mentioned or depicted on this site. Such intellectual property remains the property of its respective owners, and any references here are made solely for identification or informational purposes, without implying any affiliation, endorsement, or partnership.
We make no representations or warranties, express or implied, regarding the accuracy, completeness, or suitability of any content or products presented. Nothing on this website should be construed as legal, tax, investment, financial, medical, or other professional advice. In addition, no part of this site—including articles or product references—constitutes a solicitation, recommendation, endorsement, advertisement, or offer to buy or sell any securities, franchises, or other financial instruments, particularly in jurisdictions where such activity would be unlawful.
All content is of a general nature and may not address the specific circumstances of any individual or entity. It is not a substitute for professional advice or services. Any actions you take based on the information provided here are strictly at your own risk. You accept full responsibility for any decisions or outcomes arising from your use of this website and agree to release us from any liability in connection with your use of, or reliance upon, the content or products found herein.