
|
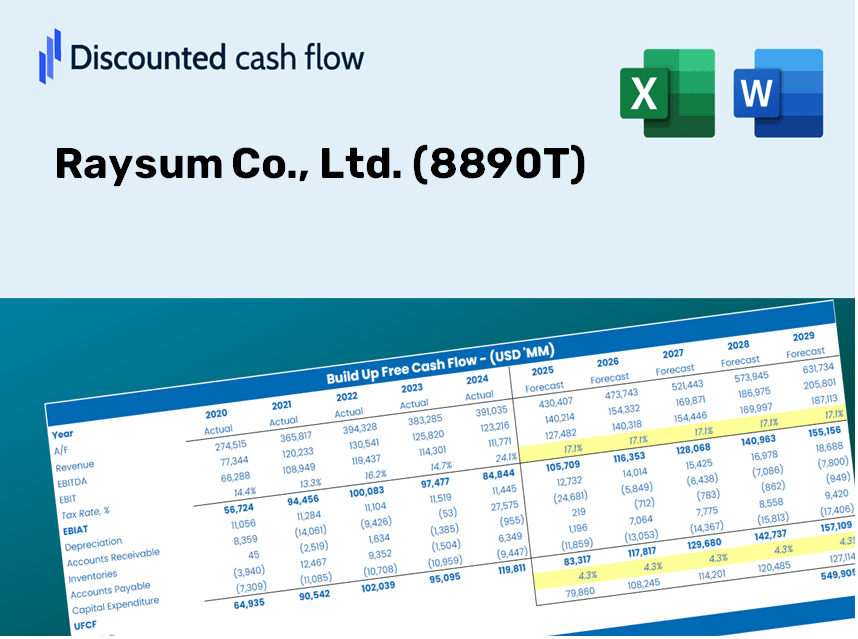
Raysum Co., Ltd. (8890.T) Valation DCF |
Entièrement Modifiable: Adapté À Vos Besoins Dans Excel Ou Sheets
Conception Professionnelle: Modèles Fiables Et Conformes Aux Normes Du Secteur
Pré-Construits Pour Une Utilisation Rapide Et Efficace
Compatible MAC/PC, entièrement débloqué
Aucune Expertise N'Est Requise; Facile À Suivre
Raysum Co., Ltd. (8890.T) Bundle
Optimisez votre temps et améliorez la précision avec notre (8890T) Calculator DCF! Équipée de données réelles de Raysum Co., Ltd. et des hypothèses personnalisables, cet outil vous permet de prévoir, analyser et évaluer Raysum Co., Ltd. Tout comme un investisseur chevronné.
Discounted Cash Flow (DCF) - (USD MM)
| Year | AY1 2019 |
AY2 2020 |
AY3 2021 |
AY4 2022 |
AY5 2023 |
FY1 2024 |
FY2 2025 |
FY3 2026 |
FY4 2027 |
FY5 2028 |
|---|---|---|---|---|---|---|---|---|---|---|
| Revenue | 54,938.0 | 32,219.0 | 68,402.0 | 67,906.0 | 94,265.0 | 117,062.5 | 145,373.4 | 180,531.2 | 224,191.7 | 278,411.3 |
| Revenue Growth, % | 0 | -41.35 | 112.3 | -0.72512 | 38.82 | 24.18 | 24.18 | 24.18 | 24.18 | 24.18 |
| EBITDA | 12,632.0 | 2,383.0 | 12,407.0 | 13,782.0 | 23,077.0 | 21,844.9 | 27,128.0 | 33,688.7 | 41,836.2 | 51,954.1 |
| EBITDA, % | 22.99 | 7.4 | 18.14 | 20.3 | 24.48 | 18.66 | 18.66 | 18.66 | 18.66 | 18.66 |
| Depreciation | 42,983.0 | 30,574.0 | 57,642.0 | 53,534.0 | 491.0 | 78,843.7 | 97,911.7 | 121,591.1 | 150,997.3 | 187,515.2 |
| Depreciation, % | 78.24 | 94.89 | 84.27 | 78.84 | 0.52087 | 67.35 | 67.35 | 67.35 | 67.35 | 67.35 |
| EBIT | -30,351.0 | -28,191.0 | -45,235.0 | -39,752.0 | 22,586.0 | -56,998.8 | -70,783.7 | -87,902.4 | -109,161.1 | -135,561.1 |
| EBIT, % | -55.25 | -87.5 | -66.13 | -58.54 | 23.96 | -48.69 | -48.69 | -48.69 | -48.69 | -48.69 |
| Total Cash | 29,325.0 | 19,922.0 | 28,222.0 | 27,524.0 | 35,728.0 | 54,997.0 | 68,297.8 | 84,815.2 | 105,327.4 | 130,800.2 |
| Total Cash, percent | .0 | .0 | .0 | .0 | .0 | .0 | .0 | .0 | .0 | .0 |
| Account Receivables | 322.0 | 307.0 | 299.0 | 367.0 | 161.0 | 629.2 | 781.3 | 970.3 | 1,205.0 | 1,496.4 |
| Account Receivables, % | 0.58612 | 0.95285 | 0.43712 | 0.54045 | 0.1708 | 0.53747 | 0.53747 | 0.53747 | 0.53747 | 0.53747 |
| Inventories | 48,390.0 | 68,154.0 | 63,133.0 | 63,672.0 | 81,464.0 | 107,829.4 | 133,907.3 | 166,292.1 | 206,508.9 | 256,452.0 |
| Inventories, % | 88.08 | 211.53 | 92.3 | 93.76 | 86.42 | 92.11 | 92.11 | 92.11 | 92.11 | 92.11 |
| Accounts Payable | .0 | .0 | .0 | .0 | .0 | .0 | .0 | .0 | .0 | .0 |
| Accounts Payable, % | 0 | 0 | 0 | 0 | 0 | 0 | 0 | 0 | 0 | 0 |
| Capital Expenditure | -970.0 | -2,150.0 | -2,318.0 | -792.0 | -586.0 | -3,187.7 | -3,958.7 | -4,916.0 | -6,105.0 | -7,581.4 |
| Capital Expenditure, % | -1.77 | -6.67 | -3.39 | -1.17 | -0.62165 | -2.72 | -2.72 | -2.72 | -2.72 | -2.72 |
| Tax Rate, % | 33.44 | 33.44 | 33.44 | 33.44 | 33.44 | 33.44 | 33.44 | 33.44 | 33.44 | 33.44 |
| EBITAT | -20,079.7 | -15,134.1 | -28,829.0 | -26,438.2 | 15,032.5 | -36,096.1 | -44,825.7 | -55,666.6 | -69,129.3 | -85,847.8 |
| Depreciation | ||||||||||
| Changes in Account Receivables | ||||||||||
| Changes in Inventories | ||||||||||
| Changes in Accounts Payable | ||||||||||
| Capital Expenditure | ||||||||||
| UFCF | -26,778.7 | -6,459.1 | 31,524.0 | 25,696.8 | -2,648.5 | 12,726.4 | 22,897.2 | 28,434.7 | 35,311.5 | 43,851.4 |
| WACC, % | 4.4 | 4.28 | 4.38 | 4.41 | 4.41 | 4.38 | 4.38 | 4.38 | 4.38 | 4.38 |
| PV UFCF | ||||||||||
| SUM PV UFCF | 123,369.6 | |||||||||
| Long Term Growth Rate, % | 0.50 | |||||||||
| Free cash flow (T + 1) | 44,071 | |||||||||
| Terminal Value | 1,137,240 | |||||||||
| Present Terminal Value | 918,047 | |||||||||
| Enterprise Value | 1,041,417 | |||||||||
| Net Debt | 19,108 | |||||||||
| Equity Value | 1,022,309 | |||||||||
| Diluted Shares Outstanding, MM | 28 | |||||||||
| Equity Value Per Share | 36,075.98 |
What You Will Receive
- Authentic Raysum Data: Preloaded financial metrics – including revenue and EBIT – based on both actual and projected figures.
- Comprehensive Customization: Modify all essential parameters (highlighted cells) such as WACC, growth %, and tax rates.
- Immediate Valuation Updates: Automatic recalculations to assess the effects of changes on Raysum's fair value.
- Flexible Excel Template: Designed for easy adjustments, scenario analysis, and in-depth projections.
- Efficient and Accurate: Bypass the need to build models from scratch while ensuring accuracy and adaptability.
Key Features
- Accurate Raysum Data: Pre-loaded with Raysum Co., Ltd.'s historical financial performance and future projections.
- Customizable Parameters: Modify revenue growth rates, profit margins, discount rates, tax percentages, and investment budgets.
- Interactive Valuation Model: Automatically recalculates Net Present Value (NPV) and intrinsic value based on your adjustments.
- Flexible Scenario Analysis: Develop various forecasting scenarios to evaluate potential valuation results.
- User-Centric Interface: Intuitive layout designed to cater to both experienced users and newcomers.
How It Works
- Step 1: Download the pre-built Excel template containing Raysum Co., Ltd. (8890T) data.
- Step 2: Review the pre-filled sheets to familiarize yourself with the essential metrics.
- Step 3: Modify forecasts and assumptions in the editable yellow cells (WACC, growth, margins).
- Step 4: Immediately view updated results, including the intrinsic value of Raysum Co., Ltd. (8890T).
- Step 5: Use the outputs to make well-informed investment decisions or create detailed reports.
Why Opt for Raysum Co., Ltd. Calculator?
- Designed for Experts: A sophisticated tool favored by analysts, CFOs, and industry consultants.
- Accurate Financial Data: Preloaded historical and projected financials for Raysum Co., Ltd. (8890T) ensure precision.
- Versatile Scenario Analysis: Easily simulate various forecasts and assumptions.
- Comprehensive Outputs: Automatically computes intrinsic value, NPV, and other critical metrics.
- User-Friendly: Detailed step-by-step instructions help you navigate the tool effortlessly.
Who Can Benefit from Raysum Co., Ltd. (8890T)?
- Investors: Accurately assess the fair value of Raysum Co., Ltd. (8890T) prior to making investment choices.
- CFOs: Utilize a sophisticated DCF model for precise financial reporting and analysis.
- Consultants: Effortlessly customize the template for client valuation reports related to Raysum Co., Ltd. (8890T).
- Entrepreneurs: Discover financial modeling strategies employed by leading corporations.
- Educators: Implement it as a resource for teaching valuation methods effectively.
Overview of Template Features
- Pre-Populated Data: Contains Raysum Co., Ltd.’s historical financial performance and projections.
- Discounted Cash Flow Model: An editable DCF valuation model with automated calculations.
- Weighted Average Cost of Capital (WACC): A specialized sheet for WACC computation based on user-defined inputs.
- Essential Financial Ratios: Evaluate Raysum Co., Ltd.'s profitability, operational efficiency, and financial leverage.
- Customizable Parameters: Easily modify revenue growth rates, profit margins, and tax percentages.
- User-Friendly Dashboard: Visual representations and tables showcasing key valuation outcomes.
Disclaimer
All information, articles, and product details provided on this website are for general informational and educational purposes only. We do not claim any ownership over, nor do we intend to infringe upon, any trademarks, copyrights, logos, brand names, or other intellectual property mentioned or depicted on this site. Such intellectual property remains the property of its respective owners, and any references here are made solely for identification or informational purposes, without implying any affiliation, endorsement, or partnership.
We make no representations or warranties, express or implied, regarding the accuracy, completeness, or suitability of any content or products presented. Nothing on this website should be construed as legal, tax, investment, financial, medical, or other professional advice. In addition, no part of this site—including articles or product references—constitutes a solicitation, recommendation, endorsement, advertisement, or offer to buy or sell any securities, franchises, or other financial instruments, particularly in jurisdictions where such activity would be unlawful.
All content is of a general nature and may not address the specific circumstances of any individual or entity. It is not a substitute for professional advice or services. Any actions you take based on the information provided here are strictly at your own risk. You accept full responsibility for any decisions or outcomes arising from your use of this website and agree to release us from any liability in connection with your use of, or reliance upon, the content or products found herein.