
|
Mécanique de Shanghai & Electrical Industry Co., Ltd. (900925.SS) Évaluation DCF |
Entièrement Modifiable: Adapté À Vos Besoins Dans Excel Ou Sheets
Conception Professionnelle: Modèles Fiables Et Conformes Aux Normes Du Secteur
Pré-Construits Pour Une Utilisation Rapide Et Efficace
Compatible MAC/PC, entièrement débloqué
Aucune Expertise N'Est Requise; Facile À Suivre
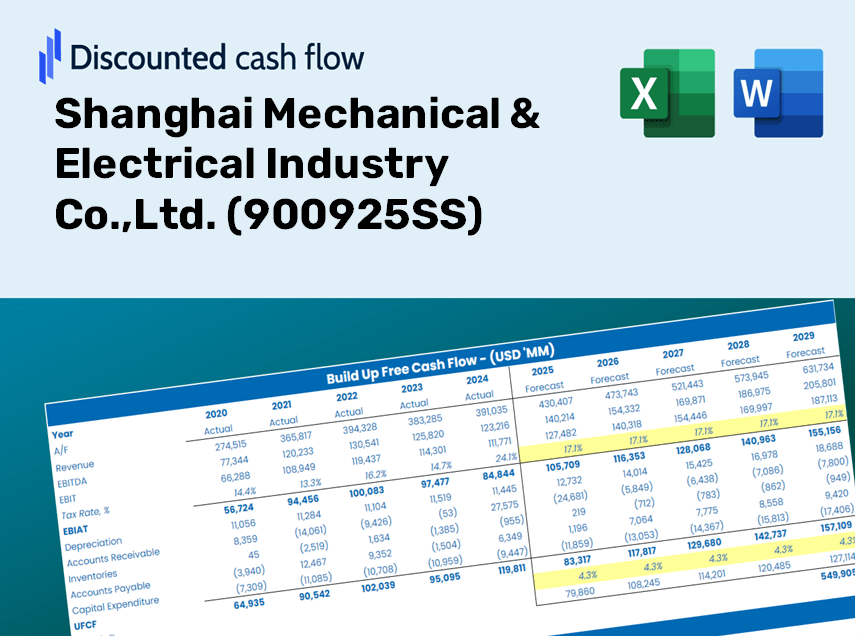
Shanghai Mechanical & Electrical Industry Co.,Ltd. (900925.SS) Bundle
Découvrez le véritable potentiel de la mécanique de Shanghai & Electrical Industry Co., Ltd. avec notre calculatrice DCF de qualité professionnelle! Ajustez les hypothèses clés, explorez divers scénarios et évaluez comment différents facteurs influencent l'évaluation de la mécanique de Shanghai & Electrical Industry Co., Ltd. - Tout dans un seul modèle Excel.
Discounted Cash Flow (DCF) - (USD MM)
| Year | AY1 2020 |
AY2 2021 |
AY3 2022 |
AY4 2023 |
AY5 2024 |
FY1 2025 |
FY2 2026 |
FY3 2027 |
FY4 2028 |
FY5 2029 |
|---|---|---|---|---|---|---|---|---|---|---|
| Revenue | 3,297.0 | 3,483.4 | 3,321.7 | 3,145.8 | 2,914.8 | 2,830.1 | 2,747.9 | 2,668.0 | 2,590.4 | 2,515.2 |
| Revenue Growth, % | 0 | 5.65 | -4.64 | -5.3 | -7.34 | -2.91 | -2.91 | -2.91 | -2.91 | -2.91 |
| EBITDA | 317.6 | 219.7 | 276.1 | 282.2 | 247.9 | 236.2 | 229.3 | 222.6 | 216.2 | 209.9 |
| EBITDA, % | 9.63 | 6.31 | 8.31 | 8.97 | 8.5 | 8.34 | 8.34 | 8.34 | 8.34 | 8.34 |
| Depreciation | 38.4 | 37.5 | 40.2 | 40.4 | 38.0 | 34.2 | 33.2 | 32.2 | 31.3 | 30.4 |
| Depreciation, % | 1.16 | 1.08 | 1.21 | 1.28 | 1.3 | 1.21 | 1.21 | 1.21 | 1.21 | 1.21 |
| EBIT | 279.2 | 182.1 | 235.9 | 241.8 | 209.9 | 202.0 | 196.1 | 190.4 | 184.9 | 179.5 |
| EBIT, % | 8.47 | 5.23 | 7.1 | 7.69 | 7.2 | 7.14 | 7.14 | 7.14 | 7.14 | 7.14 |
| Total Cash | 1,665.2 | 1,655.9 | 1,719.8 | 1,829.6 | 1,874.0 | 1,541.1 | 1,496.3 | 1,452.8 | 1,410.6 | 1,369.6 |
| Total Cash, percent | .0 | .0 | .0 | .0 | .0 | .0 | .0 | .0 | .0 | .0 |
| Account Receivables | 936.8 | 983.9 | 1,030.4 | 933.5 | 1,038.6 | 865.9 | 840.8 | 816.3 | 792.6 | 769.6 |
| Account Receivables, % | 28.41 | 28.25 | 31.02 | 29.67 | 35.63 | 30.6 | 30.6 | 30.6 | 30.6 | 30.6 |
| Inventories | 1,303.7 | 1,322.2 | 1,260.1 | 1,174.8 | 855.9 | 1,031.0 | 1,001.0 | 971.9 | 943.7 | 916.2 |
| Inventories, % | 39.54 | 37.96 | 37.93 | 37.35 | 29.36 | 36.43 | 36.43 | 36.43 | 36.43 | 36.43 |
| Accounts Payable | 483.1 | 562.8 | 610.4 | 587.0 | 630.9 | 506.5 | 491.8 | 477.5 | 463.6 | 450.2 |
| Accounts Payable, % | 14.65 | 16.16 | 18.38 | 18.66 | 21.65 | 17.9 | 17.9 | 17.9 | 17.9 | 17.9 |
| Capital Expenditure | -38.5 | -23.2 | -20.9 | -19.1 | -10.2 | -19.3 | -18.8 | -18.2 | -17.7 | -17.2 |
| Capital Expenditure, % | -1.17 | -0.66542 | -0.62822 | -0.60627 | -0.34917 | -0.68306 | -0.68306 | -0.68306 | -0.68306 | -0.68306 |
| Tax Rate, % | 37.03 | 37.03 | 37.03 | 37.03 | 37.03 | 37.03 | 37.03 | 37.03 | 37.03 | 37.03 |
| EBITAT | 252.9 | 166.2 | 217.0 | 141.1 | 132.2 | 159.6 | 155.0 | 150.5 | 146.1 | 141.9 |
| Depreciation | ||||||||||
| Changes in Account Receivables | ||||||||||
| Changes in Inventories | ||||||||||
| Changes in Accounts Payable | ||||||||||
| Capital Expenditure | ||||||||||
| UFCF | -1,504.6 | 194.6 | 299.6 | 321.2 | 417.8 | 47.6 | 209.8 | 203.7 | 197.8 | 192.1 |
| WACC, % | 5.66 | 5.67 | 5.67 | 5.66 | 5.66 | 5.66 | 5.66 | 5.66 | 5.66 | 5.66 |
| PV UFCF | ||||||||||
| SUM PV UFCF | 710.2 | |||||||||
| Long Term Growth Rate, % | 2.00 | |||||||||
| Free cash flow (T + 1) | 196 | |||||||||
| Terminal Value | 5,348 | |||||||||
| Present Terminal Value | 4,061 | |||||||||
| Enterprise Value | 4,771 | |||||||||
| Net Debt | -1,866 | |||||||||
| Equity Value | 6,637 | |||||||||
| Diluted Shares Outstanding, MM | 1,019 | |||||||||
| Equity Value Per Share | 6.51 |
Benefits You Will Receive
- Comprehensive Financial Model: Leverage Shanghai Mechanical & Electrical Industry Co., Ltd.’s actual data for accurate DCF valuation.
- Enhanced Forecast Control: Modify revenue growth, profit margins, WACC, and other critical variables to reflect your insights.
- Real-Time Calculations: Automatic updates provide immediate feedback as you adjust inputs.
- Professional-Grade Template: A polished Excel file crafted for high-quality valuations.
- Flexible and Reusable: Customizable for your needs, allowing for repeated application in detailed forecasts.
Key Features
- Pre-Loaded Data: Comprehensive historical financial statements and forecasts for Shanghai Mechanical & Electrical Industry Co., Ltd. (900925SS).
- Fully Adjustable Inputs: Customize WACC, tax rates, revenue growth, and EBITDA margins to tailor your analysis.
- Instant Results: Watch the intrinsic value of Shanghai Mechanical & Electrical Industry Co., Ltd. (900925SS) update in real time.
- Clear Visual Outputs: Intuitive dashboard charts present valuation results and essential metrics for easy interpretation.
- Built for Accuracy: A professional-grade tool designed for analysts, investors, and finance professionals.
How It Operates
- 1. Access the Template: Download and open the Excel file containing Shanghai Mechanical & Electrical Industry Co., Ltd.'s preloaded data.
- 2. Adjust Assumptions: Modify key parameters such as growth rates, WACC, and capital expenditures.
- 3. View Results Immediately: The DCF model automatically calculates the intrinsic value and NPV.
- 4. Explore Scenarios: Analyze various forecasts to evaluate different valuation results.
- 5. Present with Assurance: Deliver professional valuation insights to back your decision-making.
Why Choose This Calculator for Shanghai Mechanical & Electrical Industry Co., Ltd. (900925SS)?
- User-Friendly Interface: Tailored for both novice and seasoned users.
- Customizable Inputs: Adjust parameters easily to suit your specific analysis.
- Real-Time Feedback: Witness immediate updates to the valuation of Shanghai Mechanical & Electrical Industry as you modify inputs.
- Preloaded Data: Comes equipped with actual financial information for Shanghai Mechanical & Electrical Industry for quick assessments.
- Valued by Experts: Trusted by investors and analysts for making strategic decisions.
Who Can Benefit from This Product?
- Investors: Make informed investment choices by accurately assessing the fair value of Shanghai Mechanical & Electrical Industry Co., Ltd. (900925SS).
- CFOs: Utilize a high-quality DCF model for precise financial reporting and analysis.
- Consultants: Easily customize the template for client valuation reports.
- Entrepreneurs: Discover financial modeling techniques employed by leading industry players.
- Educators: Employ this tool as an instructional resource to illustrate valuation methods.
Contents of the Template
- Operating and Balance Sheet Data: Pre-filled historical data and forecasts for Shanghai Mechanical & Electrical Industry Co., Ltd. (900925SS), including revenue, EBITDA, EBIT, and capital expenditures.
- WACC Calculation: A dedicated sheet for calculating the Weighted Average Cost of Capital (WACC), featuring parameters such as Beta, risk-free rate, and share price.
- DCF Valuation (Unlevered and Levered): Editable Discounted Cash Flow models that provide intrinsic value estimates along with detailed calculations.
- Financial Statements: Pre-loaded annual and quarterly financial statements to facilitate in-depth analysis.
- Key Ratios: Includes various profitability, leverage, and efficiency ratios specific to Shanghai Mechanical & Electrical Industry Co., Ltd. (900925SS).
- Dashboard and Charts: A visual summary of valuation outputs and assumptions for easier analysis of results.
Disclaimer
All information, articles, and product details provided on this website are for general informational and educational purposes only. We do not claim any ownership over, nor do we intend to infringe upon, any trademarks, copyrights, logos, brand names, or other intellectual property mentioned or depicted on this site. Such intellectual property remains the property of its respective owners, and any references here are made solely for identification or informational purposes, without implying any affiliation, endorsement, or partnership.
We make no representations or warranties, express or implied, regarding the accuracy, completeness, or suitability of any content or products presented. Nothing on this website should be construed as legal, tax, investment, financial, medical, or other professional advice. In addition, no part of this site—including articles or product references—constitutes a solicitation, recommendation, endorsement, advertisement, or offer to buy or sell any securities, franchises, or other financial instruments, particularly in jurisdictions where such activity would be unlawful.
All content is of a general nature and may not address the specific circumstances of any individual or entity. It is not a substitute for professional advice or services. Any actions you take based on the information provided here are strictly at your own risk. You accept full responsibility for any decisions or outcomes arising from your use of this website and agree to release us from any liability in connection with your use of, or reliance upon, the content or products found herein.