
|
Nankai Electric Railway Co., Ltd. (9044.T) Évaluation DCF |
Entièrement Modifiable: Adapté À Vos Besoins Dans Excel Ou Sheets
Conception Professionnelle: Modèles Fiables Et Conformes Aux Normes Du Secteur
Pré-Construits Pour Une Utilisation Rapide Et Efficace
Compatible MAC/PC, entièrement débloqué
Aucune Expertise N'Est Requise; Facile À Suivre
Nankai Electric Railway Co., Ltd. (9044.T) Bundle
Découvrez la vraie valeur de Nankai Electric Railway Co., Ltd. (9044T) avec notre calculatrice DCF de qualité professionnelle! Ajustez les hypothèses clés, explorez plusieurs scénarios et évaluez comment les changements affectent la valorisation de Nankai Electric Railway Co., Ltd. (9044T) - le tout dans un seul modèle Excel.
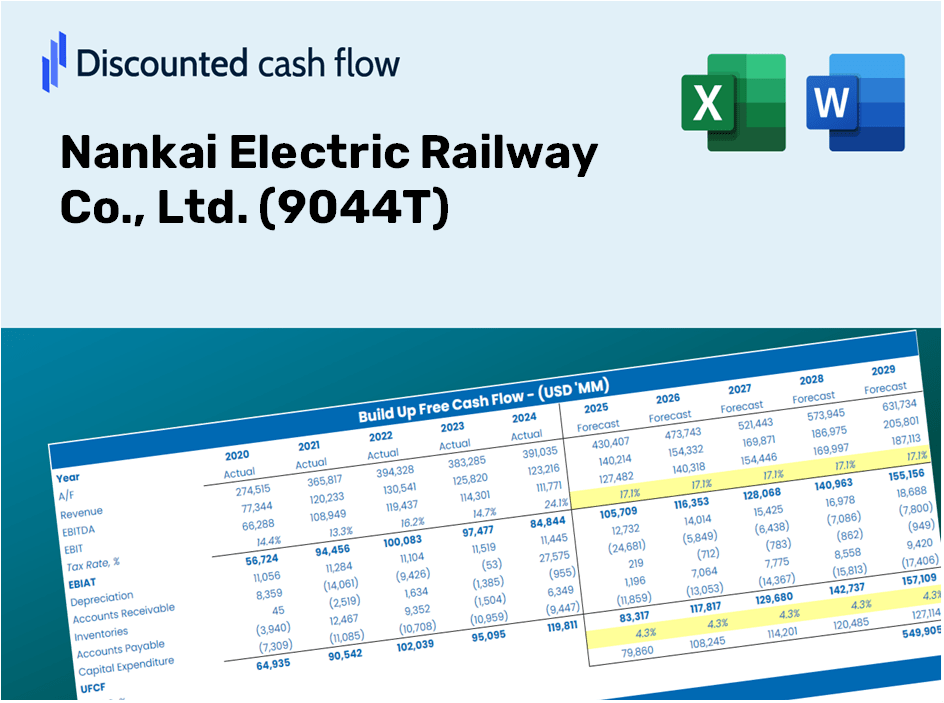
Discounted Cash Flow (DCF) - (USD MM)
| Year | AY1 2020 |
AY2 2021 |
AY3 2022 |
AY4 2023 |
AY5 2024 |
FY1 2025 |
FY2 2026 |
FY3 2027 |
FY4 2028 |
FY5 2029 |
|---|---|---|---|---|---|---|---|---|---|---|
| Revenue | 190,813.0 | 201,793.0 | 221,280.0 | 241,594.0 | 260,787.0 | 263,517.8 | 266,277.3 | 269,065.6 | 271,883.1 | 274,730.2 |
| Revenue Growth, % | 0 | 5.75 | 9.66 | 9.18 | 7.94 | 1.05 | 1.05 | 1.05 | 1.05 | 1.05 |
| EBITDA | 32,657.0 | 41,012.0 | 50,717.0 | 64,802.0 | 66,047.0 | 59,295.2 | 59,916.1 | 60,543.5 | 61,177.5 | 61,818.1 |
| EBITDA, % | 17.11 | 20.32 | 22.92 | 26.82 | 25.33 | 22.5 | 22.5 | 22.5 | 22.5 | 22.5 |
| Depreciation | 29,705.0 | 28,821.0 | 27,849.0 | 27,707.0 | 28,579.0 | 34,184.9 | 34,542.9 | 34,904.6 | 35,270.1 | 35,639.4 |
| Depreciation, % | 15.57 | 14.28 | 12.59 | 11.47 | 10.96 | 12.97 | 12.97 | 12.97 | 12.97 | 12.97 |
| EBIT | 2,952.0 | 12,191.0 | 22,868.0 | 37,095.0 | 37,468.0 | 25,110.3 | 25,373.2 | 25,638.9 | 25,907.4 | 26,178.7 |
| EBIT, % | 1.55 | 6.04 | 10.33 | 15.35 | 14.37 | 9.53 | 9.53 | 9.53 | 9.53 | 9.53 |
| Total Cash | 41,856.0 | 36,470.0 | 38,409.0 | 43,286.0 | 42,849.0 | 48,336.4 | 48,842.6 | 49,354.0 | 49,870.8 | 50,393.1 |
| Total Cash, percent | .0 | .0 | .0 | .0 | .0 | .0 | .0 | .0 | .0 | .0 |
| Account Receivables | 25,992.0 | 23,013.0 | 23,802.0 | 22,950.0 | 35,543.0 | 31,048.2 | 31,373.3 | 31,701.9 | 32,033.8 | 32,369.3 |
| Account Receivables, % | 13.62 | 11.4 | 10.76 | 9.5 | 13.63 | 11.78 | 11.78 | 11.78 | 11.78 | 11.78 |
| Inventories | 19,851.0 | 16,523.0 | 26,692.0 | 25,020.0 | 27,441.0 | 27,159.5 | 27,443.9 | 27,731.3 | 28,021.7 | 28,315.1 |
| Inventories, % | 10.4 | 8.19 | 12.06 | 10.36 | 10.52 | 10.31 | 10.31 | 10.31 | 10.31 | 10.31 |
| Accounts Payable | 20,665.0 | 19,217.0 | 19,453.0 | 17,244.0 | 23,493.0 | 23,869.6 | 24,119.6 | 24,372.1 | 24,627.3 | 24,885.2 |
| Accounts Payable, % | 10.83 | 9.52 | 8.79 | 7.14 | 9.01 | 9.06 | 9.06 | 9.06 | 9.06 | 9.06 |
| Capital Expenditure | -36,756.0 | -23,237.0 | -32,948.0 | -30,393.0 | -36,344.0 | -38,043.7 | -38,442.1 | -38,844.6 | -39,251.4 | -39,662.4 |
| Capital Expenditure, % | -19.26 | -11.52 | -14.89 | -12.58 | -13.94 | -14.44 | -14.44 | -14.44 | -14.44 | -14.44 |
| Tax Rate, % | 34.29 | 34.29 | 34.29 | 34.29 | 34.29 | 34.29 | 34.29 | 34.29 | 34.29 | 34.29 |
| EBITAT | 4,589.5 | 5,989.7 | 17,260.2 | 26,263.9 | 24,620.8 | 18,135.8 | 18,325.7 | 18,517.6 | 18,711.5 | 18,907.5 |
| Depreciation | ||||||||||
| Changes in Account Receivables | ||||||||||
| Changes in Inventories | ||||||||||
| Changes in Accounts Payable | ||||||||||
| Capital Expenditure | ||||||||||
| UFCF | -27,639.5 | 16,432.7 | 1,439.2 | 23,892.9 | 8,090.8 | 19,429.9 | 14,067.0 | 14,214.3 | 14,363.1 | 14,513.5 |
| WACC, % | 4.55 | 3.49 | 4.04 | 3.94 | 3.84 | 3.97 | 3.97 | 3.97 | 3.97 | 3.97 |
| PV UFCF | ||||||||||
| SUM PV UFCF | 68,584.4 | |||||||||
| Long Term Growth Rate, % | 1.00 | |||||||||
| Free cash flow (T + 1) | 14,659 | |||||||||
| Terminal Value | 493,354 | |||||||||
| Present Terminal Value | 406,063 | |||||||||
| Enterprise Value | 474,647 | |||||||||
| Net Debt | 390,101 | |||||||||
| Equity Value | 84,546 | |||||||||
| Diluted Shares Outstanding, MM | 113 | |||||||||
| Equity Value Per Share | 746.68 |
What You Will Receive
- Genuine Nankai Electric Financials: Access to historical and projected data for precise valuation.
- Customizable Inputs: Adjust parameters such as WACC, tax rates, revenue growth, and capital expenditures.
- Real-Time Calculations: Dynamic calculations for intrinsic value and NPV.
- Scenario Analysis: Explore various scenarios to assess Nankai Electric's future performance.
- User-Friendly Layout: Designed for professionals while remaining user-friendly for newcomers.
Key Features
- 🔍 Real-Life Nankai Electric Railway Financials: Pre-filled historical and projected data for Nankai Electric Railway Co., Ltd. (9044T).
- ✏️ Fully Customizable Inputs: Tailor all essential parameters (yellow cells) such as WACC, growth %, and tax rates to suit your analysis.
- 📊 Professional DCF Valuation: Integrated formulas compute Nankai's intrinsic value using the Discounted Cash Flow method.
- ⚡ Instant Results: Visualize Nankai’s valuation immediately after making adjustments.
- Scenario Analysis: Evaluate and contrast outcomes based on different financial assumptions side-by-side.
How It Operates
- Download the Template: Obtain immediate access to the Excel-based Nankai Electric Railway DCF Calculator.
- Enter Your Assumptions: Modify the yellow-highlighted cells for growth rates, WACC, profit margins, and more.
- Receive Instant Calculations: The model automatically recalculates Nankai Electric Railway’s intrinsic value.
- Experiment with Scenarios: Test various assumptions to assess potential changes in valuation.
- Evaluate and Decide: Leverage the results to inform your investment or financial decisions.
Why Choose Nankai Electric Railway Co., Ltd. ([9044T])?
- Save Time: Quickly access vital transportation data without the hassle of manual calculations.
- Enhance Precision: Dependable metrics and methodologies minimize discrepancies in project evaluations.
- Completely Customizable: Adjust the model to align with your specific operational insights and forecasts.
- User-Friendly: Intuitive visuals and reports simplify the analysis of your findings.
- Endorsed by Professionals: Crafted for industry experts who prioritize accuracy and convenience.
Who Can Benefit from This Product?
- Investors: Assess Nankai Electric Railway's valuation prior to making stock transactions.
- CFOs and Financial Analysts: Optimize valuation methodologies and evaluate financial forecasts.
- Startup Founders: Gain insights into how established firms like Nankai Electric Railway are appraised.
- Consultants: Provide expert valuation assessments for your clientele.
- Students and Educators: Utilize real-time data to practice and instruct valuation methods.
Overview of the Template Components
- Preloaded Nankai Electric Railway Data: Historical and projected financial metrics, including revenue, EBIT, and capital expenses.
- DCF and WACC Models: Advanced sheets for determining intrinsic value and Weighted Average Cost of Capital.
- Editable Inputs: Cells highlighted in yellow for modifying revenue growth, tax rates, and discount rates.
- Financial Statements: Detailed annual and quarterly financial information for in-depth analysis.
- Key Ratios: Metrics for profitability, leverage, and efficiency to assess performance.
- Dashboard and Charts: Visual representations of valuation results and underlying assumptions.
Disclaimer
All information, articles, and product details provided on this website are for general informational and educational purposes only. We do not claim any ownership over, nor do we intend to infringe upon, any trademarks, copyrights, logos, brand names, or other intellectual property mentioned or depicted on this site. Such intellectual property remains the property of its respective owners, and any references here are made solely for identification or informational purposes, without implying any affiliation, endorsement, or partnership.
We make no representations or warranties, express or implied, regarding the accuracy, completeness, or suitability of any content or products presented. Nothing on this website should be construed as legal, tax, investment, financial, medical, or other professional advice. In addition, no part of this site—including articles or product references—constitutes a solicitation, recommendation, endorsement, advertisement, or offer to buy or sell any securities, franchises, or other financial instruments, particularly in jurisdictions where such activity would be unlawful.
All content is of a general nature and may not address the specific circumstances of any individual or entity. It is not a substitute for professional advice or services. Any actions you take based on the information provided here are strictly at your own risk. You accept full responsibility for any decisions or outcomes arising from your use of this website and agree to release us from any liability in connection with your use of, or reliance upon, the content or products found herein.