
|
Maruzen Showa Unyu Co., Ltd. (9068.T) Évaluation DCF |
Entièrement Modifiable: Adapté À Vos Besoins Dans Excel Ou Sheets
Conception Professionnelle: Modèles Fiables Et Conformes Aux Normes Du Secteur
Pré-Construits Pour Une Utilisation Rapide Et Efficace
Compatible MAC/PC, entièrement débloqué
Aucune Expertise N'Est Requise; Facile À Suivre
Maruzen Showa Unyu Co., Ltd. (9068.T) Bundle
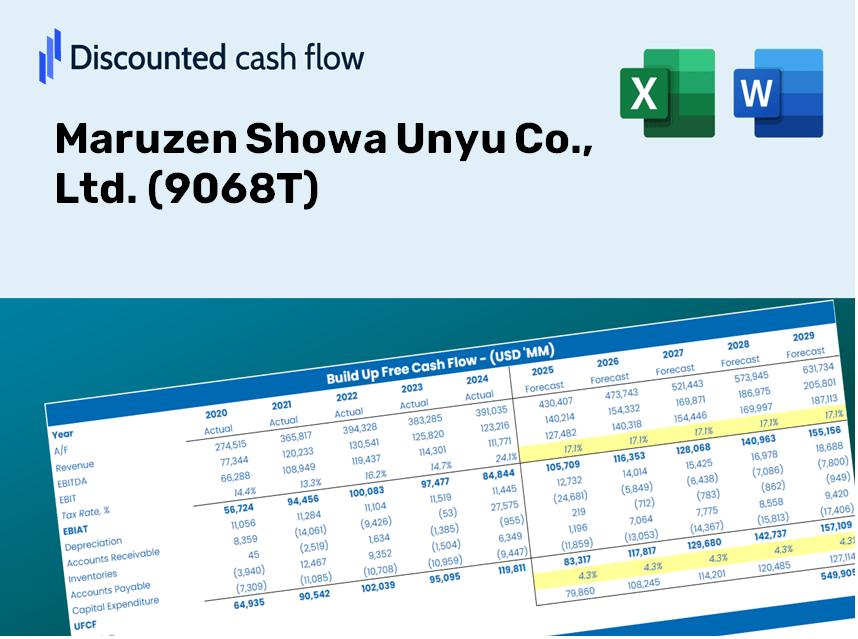
Évaluez les perspectives financières de Maruzen Showa Unyu Co., Ltd. (9068T) comme un expert! Ce (9068T) Calculator DCF est livré avec des données financières pré-remplies et offre une pleine flexibilité pour modifier la croissance des revenus, le WACC, les marges et autres hypothèses essentielles pour s'aligner sur vos prévisions.
Discounted Cash Flow (DCF) - (USD MM)
| Year | AY1 2020 |
AY2 2021 |
AY3 2022 |
AY4 2023 |
AY5 2024 |
FY1 2025 |
FY2 2026 |
FY3 2027 |
FY4 2028 |
FY5 2029 |
|---|---|---|---|---|---|---|---|---|---|---|
| Revenue | 121,136.0 | 136,850.0 | 140,861.0 | 140,194.0 | 144,572.0 | 151,277.4 | 158,293.8 | 165,635.7 | 173,318.0 | 181,356.7 |
| Revenue Growth, % | 0 | 12.97 | 2.93 | -0.47352 | 3.12 | 4.64 | 4.64 | 4.64 | 4.64 | 4.64 |
| EBITDA | 15,157.0 | 16,889.0 | 19,178.0 | 20,672.0 | 21,032.0 | 20,501.6 | 21,452.5 | 22,447.4 | 23,488.6 | 24,578.0 |
| EBITDA, % | 12.51 | 12.34 | 13.61 | 14.75 | 14.55 | 13.55 | 13.55 | 13.55 | 13.55 | 13.55 |
| Depreciation | 4,738.0 | 5,067.0 | 5,446.0 | 5,531.0 | 5,115.0 | 5,737.5 | 6,003.6 | 6,282.0 | 6,573.4 | 6,878.3 |
| Depreciation, % | 3.91 | 3.7 | 3.87 | 3.95 | 3.54 | 3.79 | 3.79 | 3.79 | 3.79 | 3.79 |
| EBIT | 10,419.0 | 11,822.0 | 13,732.0 | 15,141.0 | 15,917.0 | 14,764.1 | 15,448.9 | 16,165.4 | 16,915.2 | 17,699.7 |
| EBIT, % | 8.6 | 8.64 | 9.75 | 10.8 | 11.01 | 9.76 | 9.76 | 9.76 | 9.76 | 9.76 |
| Total Cash | 21,886.0 | 26,549.0 | 33,536.0 | 37,501.0 | 37,705.0 | 34,523.0 | 36,124.2 | 37,799.7 | 39,552.9 | 41,387.4 |
| Total Cash, percent | .0 | .0 | .0 | .0 | .0 | .0 | .0 | .0 | .0 | .0 |
| Account Receivables | 28,124.0 | 29,932.0 | 28,135.0 | 30,276.0 | 27,933.0 | 32,064.6 | 33,551.8 | 35,108.0 | 36,736.3 | 38,440.2 |
| Account Receivables, % | 23.22 | 21.87 | 19.97 | 21.6 | 19.32 | 21.2 | 21.2 | 21.2 | 21.2 | 21.2 |
| Inventories | 262.0 | 262.0 | 315.0 | 337.0 | 370.0 | 341.2 | 357.0 | 373.6 | 390.9 | 409.0 |
| Inventories, % | 0.21629 | 0.19145 | 0.22362 | 0.24038 | 0.25593 | 0.22553 | 0.22553 | 0.22553 | 0.22553 | 0.22553 |
| Accounts Payable | 12,733.0 | 13,318.0 | 12,835.0 | 13,954.0 | 12,990.0 | 14,611.4 | 15,289.1 | 15,998.2 | 16,740.3 | 17,516.7 |
| Accounts Payable, % | 10.51 | 9.73 | 9.11 | 9.95 | 8.99 | 9.66 | 9.66 | 9.66 | 9.66 | 9.66 |
| Capital Expenditure | -10,676.0 | -10,852.0 | -6,104.0 | -6,128.0 | -7,912.0 | -9,355.1 | -9,789.0 | -10,243.0 | -10,718.1 | -11,215.2 |
| Capital Expenditure, % | -8.81 | -7.93 | -4.33 | -4.37 | -5.47 | -6.18 | -6.18 | -6.18 | -6.18 | -6.18 |
| Tax Rate, % | 37.43 | 37.43 | 37.43 | 37.43 | 37.43 | 37.43 | 37.43 | 37.43 | 37.43 | 37.43 |
| EBITAT | 6,863.3 | 8,009.2 | 9,059.0 | 9,868.1 | 9,959.8 | 9,665.7 | 10,114.0 | 10,583.1 | 11,074.0 | 11,587.6 |
| Depreciation | ||||||||||
| Changes in Account Receivables | ||||||||||
| Changes in Inventories | ||||||||||
| Changes in Accounts Payable | ||||||||||
| Capital Expenditure | ||||||||||
| UFCF | -14,727.7 | 1,001.2 | 9,662.0 | 8,227.1 | 8,508.8 | 3,566.8 | 5,503.3 | 5,758.6 | 6,025.7 | 6,305.2 |
| WACC, % | 4.95 | 4.97 | 4.96 | 4.95 | 4.93 | 4.95 | 4.95 | 4.95 | 4.95 | 4.95 |
| PV UFCF | ||||||||||
| SUM PV UFCF | 23,293.9 | |||||||||
| Long Term Growth Rate, % | 0.50 | |||||||||
| Free cash flow (T + 1) | 6,337 | |||||||||
| Terminal Value | 142,328 | |||||||||
| Present Terminal Value | 111,772 | |||||||||
| Enterprise Value | 135,066 | |||||||||
| Net Debt | 6,990 | |||||||||
| Equity Value | 128,076 | |||||||||
| Diluted Shares Outstanding, MM | 20 | |||||||||
| Equity Value Per Share | 6,417.27 |
What You Will Receive
- Customizable Excel Template: A fully adaptable Excel-based DCF Calculator featuring pre-populated financial data for Maruzen Showa Unyu Co., Ltd. (9068T).
- Accurate Data: Access to historical information and forward-looking projections (highlighted in the yellow cells).
- Adjustable Forecasts: Modify key assumptions such as revenue growth, EBITDA margin, and WACC at your convenience.
- Instant Calculations: Quickly observe how your changes influence the valuation of Maruzen Showa Unyu Co., Ltd. (9068T).
- Professional Resource: Designed for investors, CFOs, consultants, and financial analysts.
- Intuitive Layout: Crafted for ease of use and clarity, complete with step-by-step guidance.
Key Features
- Customizable Input Parameters: Adjust essential factors such as shipping volume, operational costs, and fleet investments.
- Instant DCF Valuation: Quickly generates intrinsic value, NPV, and additional financial metrics.
- High Precision Results: Incorporates Maruzen Showa Unyu's real-world financial data for accurate valuation assessments.
- Simplified Scenario Analysis: Easily evaluate various scenarios and analyze their impacts.
- Efficiency Booster: Removes the hassle of constructing intricate valuation models from the ground up.
How It Works
- Step 1: Download the Excel file for Maruzen Showa Unyu Co., Ltd. (9068T).
- Step 2: Review the pre-filled financial data and forecasts for Maruzen Showa Unyu Co., Ltd. (9068T).
- Step 3: Modify key inputs such as revenue growth, WACC, and tax rates (indicated in highlighted cells).
- Step 4: Observe as the DCF model updates in real-time with your adjustments.
- Step 5: Analyze the results and leverage the findings for your investment decisions regarding Maruzen Showa Unyu Co., Ltd. (9068T).
Why Choose Maruzen Showa Unyu Co., Ltd. (9068T)?
- Reliability: Proven financial data guarantees trustworthy insights.
- Versatility: Tailored for users to experiment and adjust parameters with ease.
- Efficiency: Eliminate the need to start a financial analysis from zero.
- Expertise: Crafted with the precision and functionality expected by top financial executives.
- Accessibility: Intuitive design makes it suitable for users without extensive financial modeling skills.
Who Can Benefit from Our Services?
- Investors: Empower your investment strategies with our comprehensive logistics solutions.
- Supply Chain Professionals: Streamline operations using our expert shipping and freight services.
- Business Consultants: Adapt our services for customized client logistics presentations and recommendations.
- Logistics Enthusiasts: Enhance your knowledge of supply chain management with real-case scenarios.
- Academics and Students: Utilize our resources as a hands-on learning tool in logistics and transportation courses.
Contents of the Template
- Pre-Populated Data: Contains Maruzen Showa Unyu Co., Ltd.'s historical financial information and projections.
- Discounted Cash Flow Model: An editable DCF valuation model featuring automatic computations.
- Weighted Average Cost of Capital (WACC): A dedicated sheet for WACC calculation based on user-defined inputs.
- Key Financial Ratios: Evaluate Maruzen Showa Unyu Co., Ltd.'s profitability, efficiency, and leverage metrics.
- Customizable Inputs: Easily modify revenue growth, profit margins, and tax rates.
- User-Friendly Dashboard: Visualizations and tables that summarize essential valuation outcomes.
Disclaimer
All information, articles, and product details provided on this website are for general informational and educational purposes only. We do not claim any ownership over, nor do we intend to infringe upon, any trademarks, copyrights, logos, brand names, or other intellectual property mentioned or depicted on this site. Such intellectual property remains the property of its respective owners, and any references here are made solely for identification or informational purposes, without implying any affiliation, endorsement, or partnership.
We make no representations or warranties, express or implied, regarding the accuracy, completeness, or suitability of any content or products presented. Nothing on this website should be construed as legal, tax, investment, financial, medical, or other professional advice. In addition, no part of this site—including articles or product references—constitutes a solicitation, recommendation, endorsement, advertisement, or offer to buy or sell any securities, franchises, or other financial instruments, particularly in jurisdictions where such activity would be unlawful.
All content is of a general nature and may not address the specific circumstances of any individual or entity. It is not a substitute for professional advice or services. Any actions you take based on the information provided here are strictly at your own risk. You accept full responsibility for any decisions or outcomes arising from your use of this website and agree to release us from any liability in connection with your use of, or reliance upon, the content or products found herein.