
|
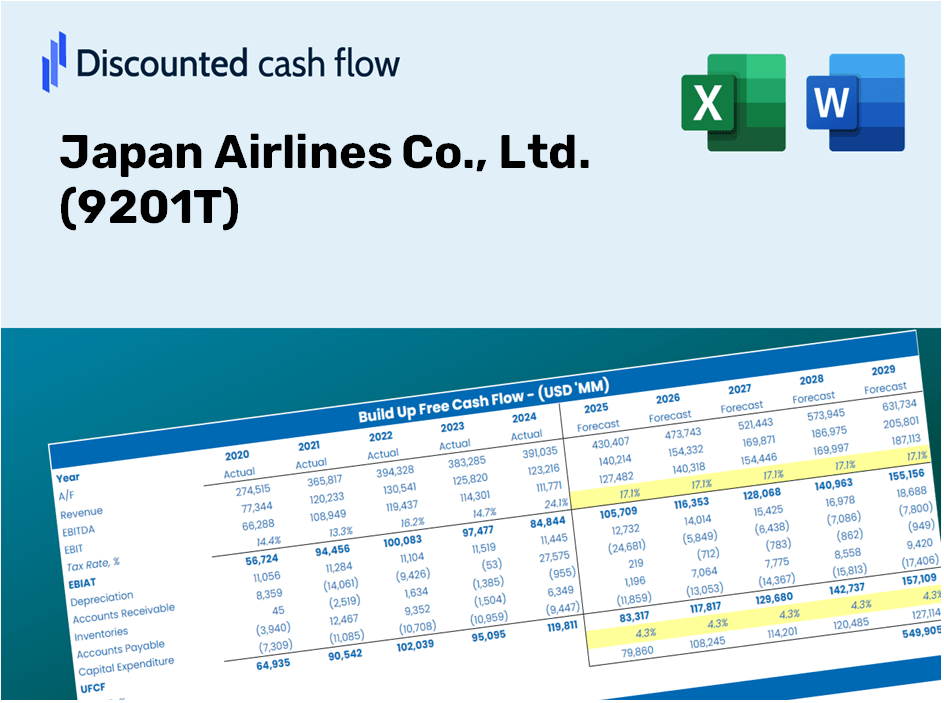
Japan Airlines Co., Ltd. (9201.T) Évaluation DCF |
Entièrement Modifiable: Adapté À Vos Besoins Dans Excel Ou Sheets
Conception Professionnelle: Modèles Fiables Et Conformes Aux Normes Du Secteur
Pré-Construits Pour Une Utilisation Rapide Et Efficace
Compatible MAC/PC, entièrement débloqué
Aucune Expertise N'Est Requise; Facile À Suivre
Japan Airlines Co., Ltd. (9201.T) Bundle
Vous cherchez à évaluer la valeur intrinsèque de Japan Airlines Co., Ltd.? Notre (9201T) Calculator DCF intègre des données réelles avec des fonctionnalités de personnalisation approfondies, vous permettant d'ajuster les prévisions et d'améliorer vos stratégies d'investissement.
Discounted Cash Flow (DCF) - (USD MM)
| Year | AY1 2021 |
AY2 2022 |
AY3 2023 |
AY4 2024 |
AY5 2025 |
FY1 2026 |
FY2 2027 |
FY3 2028 |
FY4 2029 |
FY5 2030 |
|---|---|---|---|---|---|---|---|---|---|---|
| Revenue | 481,224.0 | 705,457.0 | 1,375,588.0 | 1,651,890.0 | 1,844,095.0 | 2,643,097.2 | 3,788,287.8 | 5,429,662.2 | 7,782,204.7 | 11,154,047.5 |
| Revenue Growth, % | 0 | 46.6 | 94.99 | 20.09 | 11.64 | 43.33 | 43.33 | 43.33 | 43.33 | 43.33 |
| EBITDA | -195,339.0 | -58,727.0 | 227,443.0 | 301,600.0 | 329,210.0 | 19,704.0 | 28,241.2 | 40,477.5 | 58,015.4 | 83,152.1 |
| EBITDA, % | -40.59 | -8.32 | 16.53 | 18.26 | 17.85 | 0.74549 | 0.74549 | 0.74549 | 0.74549 | 0.74549 |
| Depreciation | 190,585.0 | 178,490.0 | 157,454.0 | 147,557.0 | 155,907.0 | 495,521.8 | 710,219.6 | 1,017,940.7 | 1,458,990.0 | 2,091,135.4 |
| Depreciation, % | 39.6 | 25.3 | 11.45 | 8.93 | 8.45 | 18.75 | 18.75 | 18.75 | 18.75 | 18.75 |
| EBIT | -385,924.0 | -237,217.0 | 69,989.0 | 154,043.0 | 173,303.0 | -475,817.9 | -681,978.3 | -977,463.2 | -1,400,974.6 | -2,007,983.3 |
| EBIT, % | -80.2 | -33.63 | 5.09 | 9.33 | 9.4 | -18 | -18 | -18 | -18 | -18 |
| Total Cash | 408,335.0 | 494,226.0 | 639,247.0 | 713,867.0 | 749,030.0 | 1,507,700.4 | 2,160,950.9 | 3,097,239.2 | 4,439,198.7 | 6,362,597.1 |
| Total Cash, percent | .0 | .0 | .0 | .0 | .0 | .0 | .0 | .0 | .0 | .0 |
| Account Receivables | 76,760.0 | 120,322.0 | 174,906.0 | 173,023.0 | 210,211.0 | 357,321.7 | 512,140.7 | 734,039.0 | 1,052,080.5 | 1,507,921.7 |
| Account Receivables, % | 15.95 | 17.06 | 12.71 | 10.47 | 11.4 | 13.52 | 13.52 | 13.52 | 13.52 | 13.52 |
| Inventories | 23,680.0 | 31,279.0 | 36,747.0 | 43,949.0 | 49,723.0 | 91,889.3 | 131,702.7 | 188,766.3 | 270,554.3 | 387,778.9 |
| Inventories, % | 4.92 | 4.43 | 2.67 | 2.66 | 2.7 | 3.48 | 3.48 | 3.48 | 3.48 | 3.48 |
| Accounts Payable | 85,618.0 | 90,360.0 | 136,138.0 | 151,894.0 | 179,207.0 | 314,053.8 | 450,125.8 | 645,154.6 | 924,684.6 | 1,325,328.2 |
| Accounts Payable, % | 17.79 | 12.81 | 9.9 | 9.2 | 9.72 | 11.88 | 11.88 | 11.88 | 11.88 | 11.88 |
| Capital Expenditure | -89,686.0 | -161,306.0 | -117,488.0 | -218,075.0 | -289,983.0 | -417,450.5 | -598,321.8 | -857,560.2 | -1,229,120.5 | -1,761,669.0 |
| Capital Expenditure, % | -18.64 | -22.87 | -8.54 | -13.2 | -15.72 | -15.79 | -15.79 | -15.79 | -15.79 | -15.79 |
| Tax Rate, % | 32.24 | 32.24 | 32.24 | 32.24 | 32.24 | 32.24 | 32.24 | 32.24 | 32.24 | 32.24 |
| EBITAT | -273,812.8 | -170,784.5 | 45,952.3 | 105,641.2 | 117,434.1 | -328,259.8 | -470,486.9 | -674,337.5 | -966,511.8 | -1,385,278.3 |
| Depreciation | ||||||||||
| Changes in Account Receivables | ||||||||||
| Changes in Inventories | ||||||||||
| Changes in Accounts Payable | ||||||||||
| Capital Expenditure | ||||||||||
| UFCF | -187,735.8 | -200,019.5 | 71,644.3 | 45,560.2 | -32,290.9 | -304,618.6 | -417,149.4 | -597,890.3 | -856,941.8 | -1,228,234.2 |
| WACC, % | 4.27 | 4.29 | 4.19 | 4.23 | 4.22 | 4.24 | 4.24 | 4.24 | 4.24 | 4.24 |
| PV UFCF | ||||||||||
| SUM PV UFCF | -2,927,842.7 | |||||||||
| Long Term Growth Rate, % | 3.00 | |||||||||
| Free cash flow (T + 1) | -1,265,081 | |||||||||
| Terminal Value | -102,108,660 | |||||||||
| Present Terminal Value | -82,968,323 | |||||||||
| Enterprise Value | -85,896,166 | |||||||||
| Net Debt | 146,993 | |||||||||
| Equity Value | -86,043,159 | |||||||||
| Diluted Shares Outstanding, MM | 437 | |||||||||
| Equity Value Per Share | -197,016.83 |
What You Will Receive
- Customizable Excel Template: A fully adaptable Excel-based DCF Calculator featuring pre-loaded financial data for Japan Airlines Co., Ltd. (9201T).
- Real-World Insights: Access to historical data and projections for future performance (highlighted in the yellow cells).
- Adjustable Forecasts: Modify forecast parameters such as revenue growth, EBITDA percentage, and WACC.
- Instant Calculations: Quickly observe how your inputs affect the valuation of Japan Airlines Co., Ltd. (9201T).
- Professional Resource: Designed for investors, CFOs, consultants, and financial analysts.
- User-Centric Design: Organized for simplicity and ease of navigation, complete with step-by-step guidance.
Key Features
- Pre-Loaded Data: Japan Airlines’ historical financial statements and pre-filled forecasts.
- Fully Adjustable Inputs: Modify WACC, tax rates, revenue growth, and EBITDA margins to fit your analysis.
- Instant Results: Observe Japan Airlines’ intrinsic value recalculating in real time.
- Clear Visual Outputs: Dashboard charts illustrate valuation results and essential metrics.
- Built for Accuracy: A professional tool designed for analysts, investors, and finance professionals.
How It Works
- Step 1: Download the prebuilt Excel template containing data for Japan Airlines Co., Ltd. (9201T).
- Step 2: Navigate through the pre-filled sheets to familiarize yourself with the key performance indicators.
- Step 3: Modify forecasts and assumptions in the editable yellow cells (WACC, growth, margins).
- Step 4: Instantly see the updated results, including the intrinsic value of Japan Airlines Co., Ltd. (9201T).
- Step 5: Utilize the outputs to make informed investment decisions or create detailed reports.
Why Opt for Japan Airlines Calculator?
- Precision: Leveraging authentic Japan Airlines financial data for unmatched accuracy.
- Versatility: Crafted to allow users to experiment and adjust inputs effortlessly.
- Efficiency: Eliminate the need to construct a financial model from square one.
- Top-Tier Quality: Engineered with the expertise and functionality expected at the CFO level.
- Accessible: Intuitive design ensures ease of use, even for those without extensive financial modeling skills.
Who Can Benefit from This Product?
- Professional Investors: Create comprehensive and accurate valuation models for analyzing portfolios featuring Japan Airlines (9201T).
- Corporate Finance Teams: Evaluate different valuation scenarios to inform organizational strategy at Japan Airlines (9201T).
- Consultants and Advisors: Deliver precise valuation insights for clients with interests in Japan Airlines (9201T).
- Students and Educators: Utilize real-life data to learn and teach financial modeling related to Japan Airlines (9201T).
- Aviation Enthusiasts: Gain insights into how airline companies like Japan Airlines (9201T) are valued within the industry.
What the Template Contains
- Pre-Filled Data: Features Japan Airlines’ historical financial data and projected forecasts.
- Discounted Cash Flow Model: An editable DCF valuation model equipped with automatic calculations.
- Weighted Average Cost of Capital (WACC): A specific sheet for deriving WACC using custom inputs.
- Key Financial Ratios: Evaluate Japan Airlines’ profitability, efficiency, and leverage.
- Customizable Inputs: Easily modify revenue growth, profit margins, and tax rates.
- Clear Dashboard: Visual instruments including charts and tables that summarize essential valuation results.
Disclaimer
All information, articles, and product details provided on this website are for general informational and educational purposes only. We do not claim any ownership over, nor do we intend to infringe upon, any trademarks, copyrights, logos, brand names, or other intellectual property mentioned or depicted on this site. Such intellectual property remains the property of its respective owners, and any references here are made solely for identification or informational purposes, without implying any affiliation, endorsement, or partnership.
We make no representations or warranties, express or implied, regarding the accuracy, completeness, or suitability of any content or products presented. Nothing on this website should be construed as legal, tax, investment, financial, medical, or other professional advice. In addition, no part of this site—including articles or product references—constitutes a solicitation, recommendation, endorsement, advertisement, or offer to buy or sell any securities, franchises, or other financial instruments, particularly in jurisdictions where such activity would be unlawful.
All content is of a general nature and may not address the specific circumstances of any individual or entity. It is not a substitute for professional advice or services. Any actions you take based on the information provided here are strictly at your own risk. You accept full responsibility for any decisions or outcomes arising from your use of this website and agree to release us from any liability in connection with your use of, or reliance upon, the content or products found herein.