
|
ANA Holdings Inc. (9202.T) Évaluation DCF |
Entièrement Modifiable: Adapté À Vos Besoins Dans Excel Ou Sheets
Conception Professionnelle: Modèles Fiables Et Conformes Aux Normes Du Secteur
Pré-Construits Pour Une Utilisation Rapide Et Efficace
Compatible MAC/PC, entièrement débloqué
Aucune Expertise N'Est Requise; Facile À Suivre
ANA Holdings Inc. (9202.T) Bundle
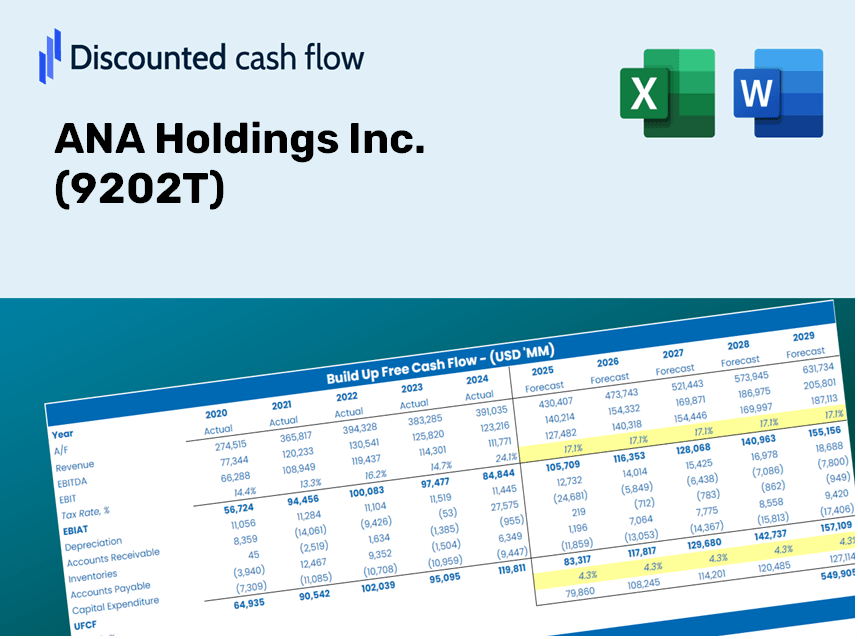
Explorez l'avenir financier d'ANA Holdings Inc. (9202T) avec notre calculatrice DCF conviviale! Entrez vos hypothèses concernant la croissance, les marges et les coûts pour calculer la valeur intrinsèque d'ANA Holdings Inc. (9202T) et affiner votre stratégie d'investissement.
What You Will Receive
- Adjustable Forecast Inputs: Effortlessly modify assumptions (growth %, profit margins, WACC) to explore various scenarios.
- Comprehensive Data: ANA Holdings Inc.’s financial information pre-loaded to kickstart your analysis.
- Automated DCF Results: The template computes Net Present Value (NPV) and intrinsic value for your convenience.
- Customizable and Professional Design: A sleek Excel model tailored to meet your valuation requirements.
- Designed for Analysts and Investors: Perfect for evaluating projections, confirming strategies, and enhancing efficiency.
Key Features
- Pre-Loaded Data: ANA Holdings Inc.’s historical financial statements and pre-filled forecasts.
- Fully Adjustable Inputs: Modify WACC, tax rates, revenue growth, and EBITDA margins as needed.
- Instant Results: View ANA Holdings Inc.'s intrinsic value recalculating in real time.
- Clear Visual Outputs: Dashboard charts present valuation results and essential metrics.
- Built for Accuracy: A professional tool designed for analysts, investors, and finance professionals.
How It Functions
- Step 1: Download the Excel file.
- Step 2: Examine the pre-filled data for ANA Holdings Inc. (9202T) including historical and projected figures.
- Step 3: Modify the key assumptions (highlighted in yellow) based on your evaluation.
- Step 4: Observe the automatic recalculations for the intrinsic value of ANA Holdings Inc. (9202T).
- Step 5: Utilize the results for your investment strategies or reporting purposes.
Why Opt for This Calculator?
- Precision: Utilizes actual ANA Holdings Inc. (9202T) financials to ensure data integrity.
- Adaptability: Created for users to easily experiment and adjust inputs as needed.
- Efficiency: Eliminate the complexities of constructing a DCF model from the ground up.
- High-Quality: Crafted with the meticulousness and usability expected at the CFO level.
- Intuitive: Simple to navigate, even for individuals without extensive financial modeling skills.
Who Should Consider Using ANA Holdings Inc.?
- Professional Investors: Develop comprehensive and accurate valuation models for assessing portfolio performance related to ANA Holdings (9202T).
- Corporate Finance Teams: Evaluate various valuation scenarios to inform strategic decision-making within their organizations.
- Consultants and Advisors: Equip clients with precise valuation analysis specifically for ANA Holdings (9202T).
- Students and Educators: Access real-world financial data to enhance learning and practice in financial modeling techniques.
- Aviation and Travel Enthusiasts: Gain insight into how companies like ANA Holdings (9202T) are valued within the industry.
Contents of the Template
- Detailed DCF Model: Editable template featuring comprehensive valuation calculations.
- Current Data: ANA Holdings Inc.’s historic and projected financials preloaded for thorough analysis.
- Adjustable Parameters: Modify WACC, growth rates, and tax assumptions to explore various scenarios.
- Financial Statements: Complete annual and quarterly breakdowns for enhanced insights.
- Essential Ratios: Integrated analysis for profitability, efficiency, and leverage metrics.
- Dashboard with Visual Analytics: Charts and tables that present clear and actionable outcomes.
Disclaimer
All information, articles, and product details provided on this website are for general informational and educational purposes only. We do not claim any ownership over, nor do we intend to infringe upon, any trademarks, copyrights, logos, brand names, or other intellectual property mentioned or depicted on this site. Such intellectual property remains the property of its respective owners, and any references here are made solely for identification or informational purposes, without implying any affiliation, endorsement, or partnership.
We make no representations or warranties, express or implied, regarding the accuracy, completeness, or suitability of any content or products presented. Nothing on this website should be construed as legal, tax, investment, financial, medical, or other professional advice. In addition, no part of this site—including articles or product references—constitutes a solicitation, recommendation, endorsement, advertisement, or offer to buy or sell any securities, franchises, or other financial instruments, particularly in jurisdictions where such activity would be unlawful.
All content is of a general nature and may not address the specific circumstances of any individual or entity. It is not a substitute for professional advice or services. Any actions you take based on the information provided here are strictly at your own risk. You accept full responsibility for any decisions or outcomes arising from your use of this website and agree to release us from any liability in connection with your use of, or reliance upon, the content or products found herein.