
|
Daiiei Kankyo Co., Ltd. (9336.T) Évaluation DCF |
Entièrement Modifiable: Adapté À Vos Besoins Dans Excel Ou Sheets
Conception Professionnelle: Modèles Fiables Et Conformes Aux Normes Du Secteur
Pré-Construits Pour Une Utilisation Rapide Et Efficace
Compatible MAC/PC, entièrement débloqué
Aucune Expertise N'Est Requise; Facile À Suivre
Daiei Kankyo Co., Ltd. (9336.T) Bundle
Conçu pour la précision, notre (9336T) Calculator DCF vous permet d'évaluer l'évaluation de Daiiei Kankyo Co., Ltd. en utilisant des données financières réelles, tout en offrant une flexibilité complète pour modifier tous les paramètres essentiels pour des projections améliorées.
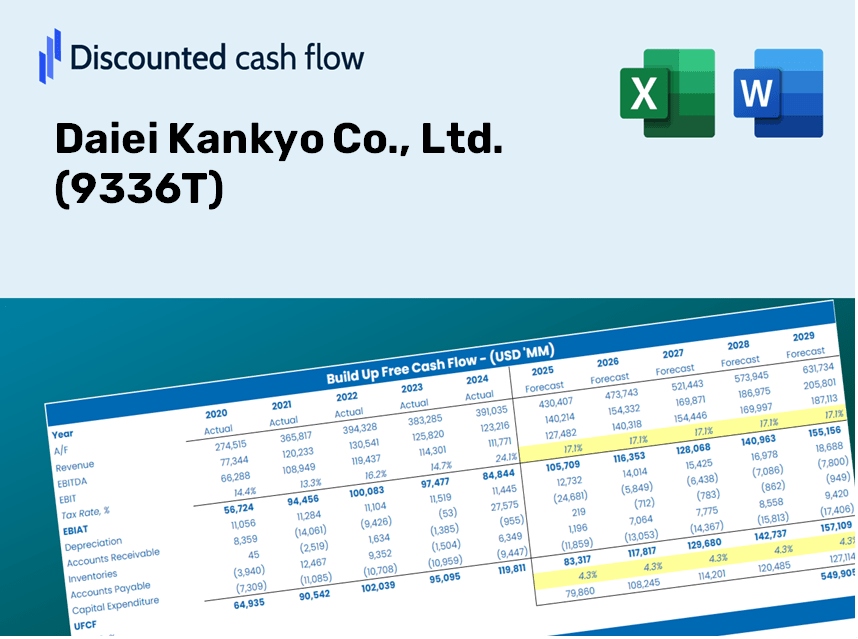
Discounted Cash Flow (DCF) - (USD MM)
| Year | AY1 2020 |
AY2 2021 |
AY3 2022 |
AY4 2023 |
AY5 2024 |
FY1 2025 |
FY2 2026 |
FY3 2027 |
FY4 2028 |
FY5 2029 |
|---|---|---|---|---|---|---|---|---|---|---|
| Revenue | 61,608.0 | 64,992.0 | 67,658.0 | 73,035.0 | 80,178.0 | 85,654.6 | 91,505.4 | 97,755.7 | 104,433.0 | 111,566.4 |
| Revenue Growth, % | 0 | 5.49 | 4.1 | 7.95 | 9.78 | 6.83 | 6.83 | 6.83 | 6.83 | 6.83 |
| EBITDA | 21,389.0 | 21,048.0 | 22,394.0 | 27,341.0 | 28,512.0 | 29,670.5 | 31,697.2 | 33,862.3 | 36,175.3 | 38,646.3 |
| EBITDA, % | 34.72 | 32.39 | 33.1 | 37.44 | 35.56 | 34.64 | 34.64 | 34.64 | 34.64 | 34.64 |
| Depreciation | 6,990.0 | 6,985.0 | 5,625.0 | 6,581.0 | 6,621.0 | 8,167.3 | 8,725.2 | 9,321.2 | 9,957.9 | 10,638.1 |
| Depreciation, % | 11.35 | 10.75 | 8.31 | 9.01 | 8.26 | 9.54 | 9.54 | 9.54 | 9.54 | 9.54 |
| EBIT | 14,399.0 | 14,063.0 | 16,769.0 | 20,760.0 | 21,891.0 | 21,503.2 | 22,972.0 | 24,541.1 | 26,217.4 | 28,008.2 |
| EBIT, % | 23.37 | 21.64 | 24.78 | 28.42 | 27.3 | 25.1 | 25.1 | 25.1 | 25.1 | 25.1 |
| Total Cash | 62,983.0 | 61,060.0 | 54,808.0 | 51,048.0 | 53,365.0 | 70,478.5 | 75,292.6 | 80,435.5 | 85,929.8 | 91,799.3 |
| Total Cash, percent | .0 | .0 | .0 | .0 | .0 | .0 | .0 | .0 | .0 | .0 |
| Account Receivables | 8,901.0 | 9,342.0 | 10,069.0 | 10,900.0 | 13,450.0 | 12,917.3 | 13,799.7 | 14,742.3 | 15,749.3 | 16,825.0 |
| Account Receivables, % | 14.45 | 14.37 | 14.88 | 14.92 | 16.78 | 15.08 | 15.08 | 15.08 | 15.08 | 15.08 |
| Inventories | 306.0 | 546.0 | 532.0 | 485.0 | 725.0 | 632.4 | 675.6 | 721.7 | 771.0 | 823.7 |
| Inventories, % | 0.49669 | 0.8401 | 0.78631 | 0.66407 | 0.90424 | 0.73828 | 0.73828 | 0.73828 | 0.73828 | 0.73828 |
| Accounts Payable | 2,609.0 | 3,351.0 | 3,143.0 | 3,347.0 | 3,673.0 | 3,974.4 | 4,245.9 | 4,535.9 | 4,845.7 | 5,176.7 |
| Accounts Payable, % | 4.23 | 5.16 | 4.65 | 4.58 | 4.58 | 4.64 | 4.64 | 4.64 | 4.64 | 4.64 |
| Capital Expenditure | -14,572.0 | -17,659.0 | -12,934.0 | -13,128.0 | -16,227.0 | -18,527.8 | -19,793.4 | -21,145.4 | -22,589.7 | -24,132.8 |
| Capital Expenditure, % | -23.65 | -27.17 | -19.12 | -17.97 | -20.24 | -21.63 | -21.63 | -21.63 | -21.63 | -21.63 |
| Tax Rate, % | 33.35 | 33.35 | 33.35 | 33.35 | 33.35 | 33.35 | 33.35 | 33.35 | 33.35 | 33.35 |
| EBITAT | 9,457.9 | 9,110.3 | 10,691.7 | 13,766.1 | 14,589.9 | 14,071.0 | 15,032.1 | 16,058.9 | 17,155.8 | 18,327.7 |
| Depreciation | ||||||||||
| Changes in Account Receivables | ||||||||||
| Changes in Inventories | ||||||||||
| Changes in Accounts Payable | ||||||||||
| Capital Expenditure | ||||||||||
| UFCF | -4,722.1 | -1,502.7 | 2,461.7 | 6,639.1 | 2,519.9 | 4,637.2 | 3,309.9 | 3,536.0 | 3,777.5 | 4,035.6 |
| WACC, % | 4.7 | 4.69 | 4.69 | 4.7 | 4.7 | 4.69 | 4.69 | 4.69 | 4.69 | 4.69 |
| PV UFCF | ||||||||||
| SUM PV UFCF | 16,882.7 | |||||||||
| Long Term Growth Rate, % | 2.00 | |||||||||
| Free cash flow (T + 1) | 4,116 | |||||||||
| Terminal Value | 152,743 | |||||||||
| Present Terminal Value | 121,432 | |||||||||
| Enterprise Value | 138,315 | |||||||||
| Net Debt | 15,009 | |||||||||
| Equity Value | 123,306 | |||||||||
| Diluted Shares Outstanding, MM | 99 | |||||||||
| Equity Value Per Share | 1,249.32 |
What You Will Receive
- Authentic Daiei Kankyo Insights: Comprehensive financial data – ranging from revenue to EBIT – based on verified and projected figures.
- Complete Customization: Modify essential parameters (highlighted cells) such as WACC, growth percentages, and tax rates.
- Immediate Valuation Reflections: Automatic updates to assess the impact of changes on the fair value of Daiei Kankyo Co., Ltd. (9336T).
- Flexible Excel Template: Designed for quick adjustments, scenario analysis, and in-depth forecasts.
- Efficient and Precise: Eliminate the need to build models from the ground up, while ensuring accuracy and adaptability.
Key Features
- Genuine Daiei Kankyo Financial Data: Access reliable historical financial data and projections for informed decision-making.
- Adjustable Forecast Inputs: Customize highlighted fields such as WACC, growth rates, and profit margins.
- Automated Calculations: Benefit from real-time updates on DCF, Net Present Value (NPV), and cash flow metrics.
- User-Friendly Dashboard: Visualize your valuation insights through clear charts and summaries.
- Designed for All Skill Levels: An intuitive layout tailored for investors, CFOs, and consultants alike.
How It Operates
- Download: Obtain the user-friendly Excel file featuring Daiei Kankyo Co., Ltd.'s financial data.
- Customize: Tailor predictions, including revenue growth, EBITDA percentage, and WACC.
- Update Automatically: The intrinsic value and NPV calculations refresh in real-time.
- Test Scenarios: Develop various projections and immediately compare results.
- Make Decisions: Leverage the valuation results to inform your investment strategy.
Why Opt for Daiei Kankyo Co., Ltd. ([9336T])'s Calculator?
- All-in-One Solution: Offers DCF, WACC, and a variety of financial ratio analyses seamlessly integrated.
- Flexible Input Options: Tailor the yellow-highlighted fields to explore different scenarios and outcomes.
- In-Depth Analysis: Automatically computes the intrinsic value and Net Present Value for Daiei Kankyo.
- Ready-to-Use Data: Includes historical and projected data for reliable initial assessments.
- High-Quality Standards: Perfectly suited for financial analysts, investors, and business advisors.
Who Can Benefit from Daiei Kankyo Co., Ltd. (9336T)?
- Investors: Gain confidence in your investment choices with our expert valuation tools.
- Financial Analysts: Save valuable time with our customizable and pre-structured DCF models.
- Consultants: Effortlessly tailor our templates for impactful client presentations and reports.
- Finance Enthusiasts: Enhance your knowledge of valuation methodologies through real-world insights.
- Educators and Students: Utilize our resources as an effective learning aid in finance-related studies.
Contents of the Template
- Preloaded DK Data: Historical and forecasted financial information, including revenue, EBIT, and capital expenditures.
- DCF and WACC Models: Advanced sheets for determining intrinsic value and Weighted Average Cost of Capital.
- Editable Inputs: Yellow-highlighted fields for modifying revenue growth, tax rates, and discount rates.
- Financial Statements: Detailed annual and quarterly financial reports for in-depth analysis.
- Key Ratios: Metrics for profitability, leverage, and efficiency to assess performance.
- Dashboard and Charts: Visual representations of valuation results and underlying assumptions.
Disclaimer
All information, articles, and product details provided on this website are for general informational and educational purposes only. We do not claim any ownership over, nor do we intend to infringe upon, any trademarks, copyrights, logos, brand names, or other intellectual property mentioned or depicted on this site. Such intellectual property remains the property of its respective owners, and any references here are made solely for identification or informational purposes, without implying any affiliation, endorsement, or partnership.
We make no representations or warranties, express or implied, regarding the accuracy, completeness, or suitability of any content or products presented. Nothing on this website should be construed as legal, tax, investment, financial, medical, or other professional advice. In addition, no part of this site—including articles or product references—constitutes a solicitation, recommendation, endorsement, advertisement, or offer to buy or sell any securities, franchises, or other financial instruments, particularly in jurisdictions where such activity would be unlawful.
All content is of a general nature and may not address the specific circumstances of any individual or entity. It is not a substitute for professional advice or services. Any actions you take based on the information provided here are strictly at your own risk. You accept full responsibility for any decisions or outcomes arising from your use of this website and agree to release us from any liability in connection with your use of, or reliance upon, the content or products found herein.