
|
Nippon Television Holdings, Inc. (9404.T) Valation DCF |
Entièrement Modifiable: Adapté À Vos Besoins Dans Excel Ou Sheets
Conception Professionnelle: Modèles Fiables Et Conformes Aux Normes Du Secteur
Pré-Construits Pour Une Utilisation Rapide Et Efficace
Compatible MAC/PC, entièrement débloqué
Aucune Expertise N'Est Requise; Facile À Suivre
Nippon Television Holdings, Inc. (9404.T) Bundle
Gagnez du temps et augmentez la précision avec notre (9404T) Calculator DCF! En utilisant des données réelles de Nippon Television Holdings, Inc. et des hypothèses personnalisables, cet outil vous permet de prévoir, analyser et valoriser la télévision Nippon comme un investisseur chevronné.
What You Will Receive
- Customizable Excel Template: A fully adaptable Excel-based DCF Calculator featuring pre-filled financial data for Nippon Television Holdings, Inc. (9404T).
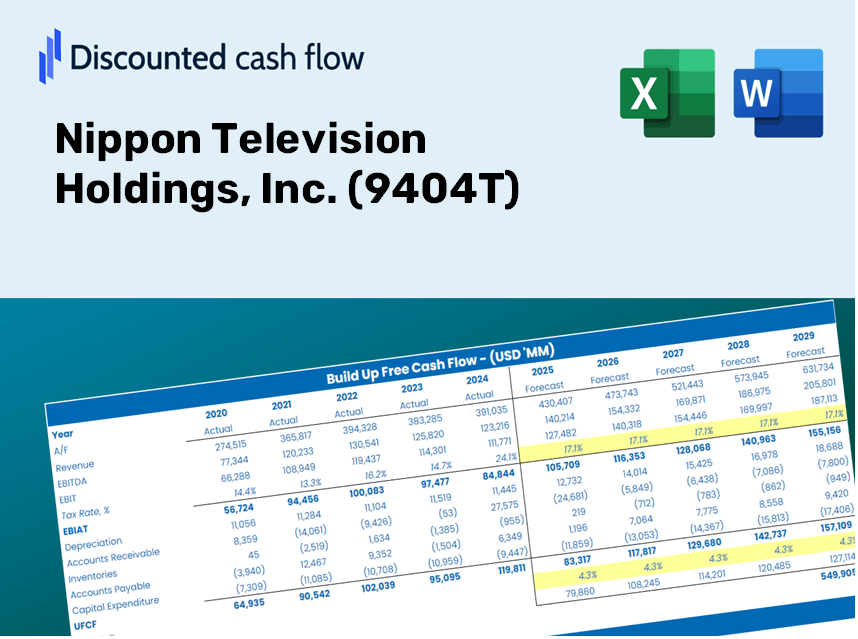
- Authentic Data: Access to historical figures and forward-looking projections (highlighted in the yellow cells).
- Adjustable Forecasts: Modify key assumptions such as revenue growth, EBITDA %, and WACC.
- Instant Calculations: Quickly observe how your inputs influence the valuation of Nippon Television Holdings, Inc. (9404T).
- Professional Resource: Designed for investors, CFOs, consultants, and financial analysts.
- User-Centric Design: Organized for straightforward navigation and includes step-by-step guidance.
Key Features
- Pre-Loaded Data: Nippon Television Holdings, Inc.'s historical financial statements and pre-filled forecasts.
- Fully Adjustable Inputs: Customize WACC, tax rates, revenue growth, and EBITDA margins.
- Instant Results: Watch Nippon Television's intrinsic value recalculate in real time.
- Clear Visual Outputs: Dashboard charts showcase valuation results and essential metrics.
- Built for Accuracy: A professional tool designed for analysts, investors, and finance specialists.
How It Works
- Step 1: Download the prebuilt Excel template featuring Nippon Television Holdings, Inc.'s (9404T) data.
- Step 2: Review the pre-filled sheets to familiarize yourself with the key performance indicators.
- Step 3: Modify forecasts and assumptions in the editable yellow cells (WACC, growth, margins).
- Step 4: Instantly observe recalibrated results, including Nippon Television Holdings, Inc.'s (9404T) intrinsic value.
- Step 5: Utilize the outputs to make informed investment decisions or create detailed reports.
Why Opt for This Calculator?
- User-Friendly Interface: Tailored for both novice and experienced users.
- Customizable Inputs: Easily adjust variables to suit your analysis needs.
- Real-Time Updates: Observe immediate changes to Nippon Television Holdings, Inc.'s (9404T) valuation as you modify inputs.
- Pre-Configured Data: Comes equipped with Nippon Television Holdings, Inc.'s (9404T) actual financial figures for swift assessments.
- Relied Upon by Experts: Favored by investors and analysts for making well-informed choices.
Who Would Benefit from This Product?
- Finance Students: Master valuation techniques and apply them using real-world data from Nippon Television Holdings, Inc. (9404T).
- Academics: Integrate professional models into lectures or research on Nippon Television Holdings, Inc. (9404T).
- Investors: Challenge your assumptions and evaluate valuation outcomes for Nippon Television Holdings, Inc. (9404T).
- Analysts: Enhance your efficiency with a customizable DCF model tailored for Nippon Television Holdings, Inc. (9404T).
- Small Business Owners: Discover insights into the analysis of major companies like Nippon Television Holdings, Inc. (9404T).
Contents of the Template
- In-Depth DCF Model: Fully editable template featuring comprehensive valuation calculations.
- Historical Financial Data: Nippon Television Holdings, Inc.'s (9404T) actual and projected financial figures preloaded for thorough analysis.
- Adjustable Variables: Modify WACC, growth rates, and tax assumptions to explore different scenarios.
- Financial Statements: Complete annual and quarterly financial breakdowns for enhanced insights.
- Essential Ratios: Integrated analysis for profitability, efficiency, and leverage metrics.
- Interactive Dashboard: Visual charts and tables delivering clear and actionable outcomes.
Disclaimer
All information, articles, and product details provided on this website are for general informational and educational purposes only. We do not claim any ownership over, nor do we intend to infringe upon, any trademarks, copyrights, logos, brand names, or other intellectual property mentioned or depicted on this site. Such intellectual property remains the property of its respective owners, and any references here are made solely for identification or informational purposes, without implying any affiliation, endorsement, or partnership.
We make no representations or warranties, express or implied, regarding the accuracy, completeness, or suitability of any content or products presented. Nothing on this website should be construed as legal, tax, investment, financial, medical, or other professional advice. In addition, no part of this site—including articles or product references—constitutes a solicitation, recommendation, endorsement, advertisement, or offer to buy or sell any securities, franchises, or other financial instruments, particularly in jurisdictions where such activity would be unlawful.
All content is of a general nature and may not address the specific circumstances of any individual or entity. It is not a substitute for professional advice or services. Any actions you take based on the information provided here are strictly at your own risk. You accept full responsibility for any decisions or outcomes arising from your use of this website and agree to release us from any liability in connection with your use of, or reliance upon, the content or products found herein.