
|
Okinawa Cellular Telephone Company (9436.T) Valation DCF |
Entièrement Modifiable: Adapté À Vos Besoins Dans Excel Ou Sheets
Conception Professionnelle: Modèles Fiables Et Conformes Aux Normes Du Secteur
Pré-Construits Pour Une Utilisation Rapide Et Efficace
Compatible MAC/PC, entièrement débloqué
Aucune Expertise N'Est Requise; Facile À Suivre
Okinawa Cellular Telephone Company (9436.T) Bundle
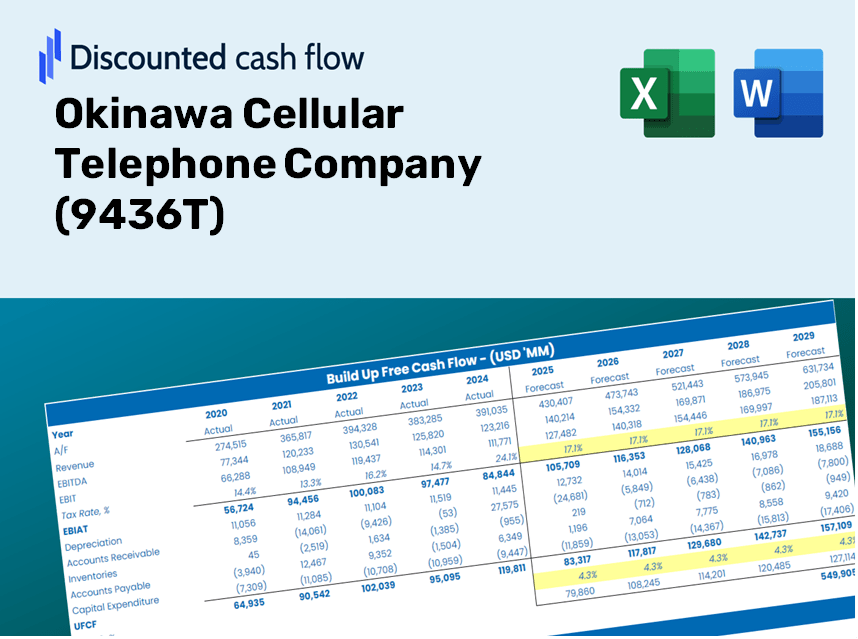
Évaluez les perspectives financières de la société de téléphone cellulaire Okinawa comme un expert! Ce (9436T) Calculator DCF fournit des données financières pré-remplies et vous permet de modifier la croissance des revenus, le WACC, les marges et d'autres hypothèses essentielles pour s'aligner sur vos projections.
What You Will Receive
- Pre-Filled Financial Model: Leverage Okinawa Cellular Telephone Company’s (9436T) actual data for accurate DCF valuation.
- Comprehensive Forecast Control: Modify key drivers such as revenue growth, profit margins, and WACC.
- Real-Time Calculations: Instant updates allow you to view results as you make adjustments.
- Professional-Grade Template: A polished Excel file crafted for high-quality valuation.
- Customizable and Reusable: Designed for versatility, enabling repeated application for in-depth forecasting.
Key Features
- Advanced DCF Calculator: Features comprehensive unlevered and levered DCF valuation models tailored for Okinawa Cellular Telephone Company (9436T).
- WACC Calculator: Comes with a pre-configured Weighted Average Cost of Capital sheet that allows for adjustable inputs specific to Okinawa Cellular.
- Customizable Forecast Assumptions: Easily modify growth projections, capital expenditures, and discount rates for accurate forecasting.
- Integrated Financial Ratios: Evaluate profitability, leverage, and efficiency ratios relevant to Okinawa Cellular Telephone Company (9436T).
- Interactive Dashboard and Charts: Visual summaries of essential valuation metrics provide straightforward analysis.
How It Works
- Step 1: Download the Excel file for Okinawa Cellular Telephone Company (9436T).
- Step 2: Examine the pre-filled financial data and forecasts for Okinawa Cellular.
- Step 3: Adjust key inputs such as revenue growth, WACC, and tax rates (highlighted cells).
- Step 4: Observe the DCF model refresh in real-time as you modify your assumptions.
- Step 5: Evaluate the output and leverage the results to inform your investment choices.
Why Opt for This Calculator?
- All-in-One Tool: Combines DCF, WACC, and financial ratio analyses into a single solution.
- Flexible Inputs: Modify the yellow-highlighted cells to explore different scenarios.
- In-Depth Analysis: Automatically calculates the intrinsic value and Net Present Value for Okinawa Cellular Telephone Company (9436T).
- Preloaded Information: Features historical and projected data for reliable starting points.
- Professional Grade: Perfect for financial analysts, investors, and business consultants alike.
Who Should Utilize This Product?
- Investors: Accurately assess the fair value of Okinawa Cellular Telephone Company (9436T) prior to making investment choices.
- CFOs: Utilize a professional-grade DCF model for financial reporting and analysis related to Okinawa Cellular Telephone Company (9436T).
- Consultants: Efficiently customize the template for valuation reports tailored to clients of Okinawa Cellular Telephone Company (9436T).
- Entrepreneurs: Acquire insights into the financial modeling practices employed by leading corporations, including Okinawa Cellular Telephone Company (9436T).
- Educators: Employ it as an instructional resource to illustrate valuation methodologies relevant to Okinawa Cellular Telephone Company (9436T).
Contents of the Template
- Historical Data: Contains Okinawa Cellular Telephone Company’s previous financials and foundational forecasts.
- DCF and Levered DCF Models: Comprehensive templates for calculating the intrinsic value of Okinawa Cellular Telephone Company.
- WACC Sheet: Pre-constructed calculations for the Weighted Average Cost of Capital.
- Editable Inputs: Adjust essential drivers such as growth rates, EBITDA percentages, and CAPEX assumptions.
- Quarterly and Annual Statements: An in-depth overview of Okinawa Cellular Telephone Company’s financials.
- Interactive Dashboard: Dynamically visualize valuation results and forecasts.
Disclaimer
All information, articles, and product details provided on this website are for general informational and educational purposes only. We do not claim any ownership over, nor do we intend to infringe upon, any trademarks, copyrights, logos, brand names, or other intellectual property mentioned or depicted on this site. Such intellectual property remains the property of its respective owners, and any references here are made solely for identification or informational purposes, without implying any affiliation, endorsement, or partnership.
We make no representations or warranties, express or implied, regarding the accuracy, completeness, or suitability of any content or products presented. Nothing on this website should be construed as legal, tax, investment, financial, medical, or other professional advice. In addition, no part of this site—including articles or product references—constitutes a solicitation, recommendation, endorsement, advertisement, or offer to buy or sell any securities, franchises, or other financial instruments, particularly in jurisdictions where such activity would be unlawful.
All content is of a general nature and may not address the specific circumstances of any individual or entity. It is not a substitute for professional advice or services. Any actions you take based on the information provided here are strictly at your own risk. You accept full responsibility for any decisions or outcomes arising from your use of this website and agree to release us from any liability in connection with your use of, or reliance upon, the content or products found herein.