
|
Chubu Electric Power Company, Incorporated (9502.T) Évaluation DCF |
Entièrement Modifiable: Adapté À Vos Besoins Dans Excel Ou Sheets
Conception Professionnelle: Modèles Fiables Et Conformes Aux Normes Du Secteur
Pré-Construits Pour Une Utilisation Rapide Et Efficace
Compatible MAC/PC, entièrement débloqué
Aucune Expertise N'Est Requise; Facile À Suivre
Chubu Electric Power Company, Incorporated (9502.T) Bundle
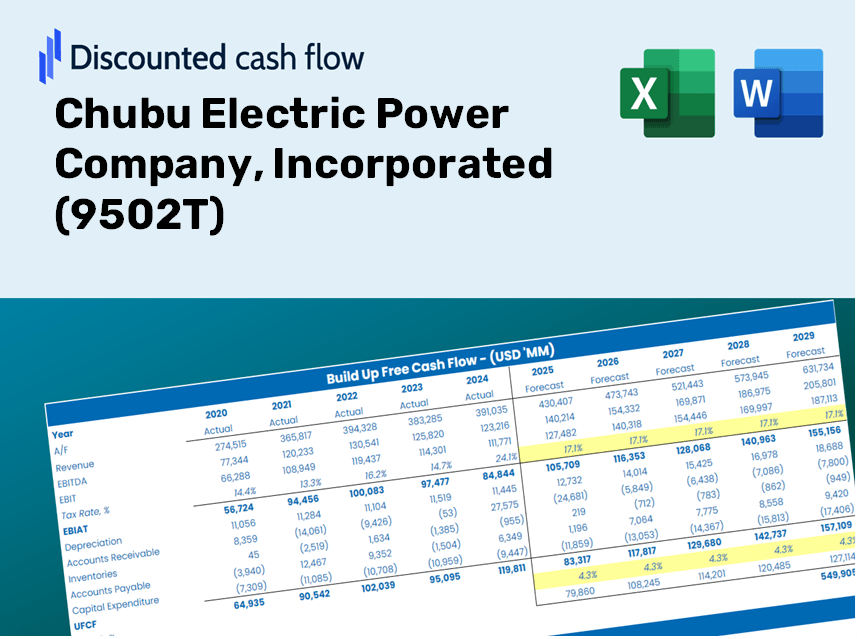
Améliorez vos choix d'investissement avec la calculatrice DCF (9502T)! Utilisez les données financières de la société électrique Chubu Authentic Chubu, ajustez les projections et dépenses de croissance et observez immédiatement comment ces modifications affectent la valeur intrinsèque de (9502T).
Discounted Cash Flow (DCF) - (USD MM)
| Year | AY1 2021 |
AY2 2022 |
AY3 2023 |
AY4 2024 |
AY5 2025 |
FY1 2026 |
FY2 2027 |
FY3 2028 |
FY4 2029 |
FY5 2030 |
|---|---|---|---|---|---|---|---|---|---|---|
| Revenue | 2,935,409.0 | 2,705,161.0 | 3,986,681.0 | 3,610,414.0 | 3,669,234.0 | 3,960,208.0 | 4,274,256.6 | 4,613,209.6 | 4,979,041.8 | 5,373,885.0 |
| Revenue Growth, % | 0 | -7.84 | 47.37 | -9.44 | 1.63 | 7.93 | 7.93 | 7.93 | 7.93 | 7.93 |
| EBITDA | 403,631.0 | 173,391.0 | 255,064.0 | 699,641.0 | 464,237.0 | 464,045.5 | 500,844.8 | 540,562.3 | 583,429.4 | 629,696.0 |
| EBITDA, % | 13.75 | 6.41 | 6.4 | 19.38 | 12.65 | 11.72 | 11.72 | 11.72 | 11.72 | 11.72 |
| Depreciation | 191,969.0 | 198,879.0 | 166,184.0 | 172,046.0 | 170,881.0 | 217,672.7 | 234,934.4 | 253,564.9 | 273,672.9 | 295,375.4 |
| Depreciation, % | 6.54 | 7.35 | 4.17 | 4.77 | 4.66 | 5.5 | 5.5 | 5.5 | 5.5 | 5.5 |
| EBIT | 211,662.0 | -25,488.0 | 88,880.0 | 527,595.0 | 293,356.0 | 246,372.8 | 265,910.4 | 286,997.3 | 309,756.5 | 334,320.5 |
| EBIT, % | 7.21 | -0.9422 | 2.23 | 14.61 | 8 | 6.22 | 6.22 | 6.22 | 6.22 | 6.22 |
| Total Cash | 176,460.0 | 203,207.0 | 361,325.0 | 390,806.0 | 293,547.0 | 327,993.9 | 354,004.1 | 382,077.0 | 412,376.1 | 445,078.0 |
| Total Cash, percent | .0 | .0 | .0 | .0 | .0 | .0 | .0 | .0 | .0 | .0 |
| Account Receivables | 307,173.0 | 341,400.0 | 365,548.0 | 352,774.0 | 311,056.0 | 399,999.8 | 431,720.2 | 465,956.1 | 502,906.9 | 542,787.9 |
| Account Receivables, % | 10.46 | 12.62 | 9.17 | 9.77 | 8.48 | 10.1 | 10.1 | 10.1 | 10.1 | 10.1 |
| Inventories | 38,721.0 | 190,779.0 | 196,444.0 | 270,501.0 | 305,019.0 | 230,516.9 | 248,797.1 | 268,527.0 | 289,821.5 | 312,804.6 |
| Inventories, % | 1.32 | 7.05 | 4.93 | 7.49 | 8.31 | 5.82 | 5.82 | 5.82 | 5.82 | 5.82 |
| Accounts Payable | 200,397.0 | 279,243.0 | 327,487.0 | 271,297.0 | 229,390.0 | 309,926.0 | 334,503.5 | 361,030.0 | 389,660.0 | 420,560.4 |
| Accounts Payable, % | 6.83 | 10.32 | 8.21 | 7.51 | 6.25 | 7.83 | 7.83 | 7.83 | 7.83 | 7.83 |
| Capital Expenditure | -211,936.0 | -232,153.0 | -249,044.0 | -248,666.0 | -272,541.0 | -288,017.5 | -310,857.6 | -335,508.9 | -362,115.1 | -390,831.2 |
| Capital Expenditure, % | -7.22 | -8.58 | -6.25 | -6.89 | -7.43 | -7.27 | -7.27 | -7.27 | -7.27 | -7.27 |
| Tax Rate, % | 25.01 | 25.01 | 25.01 | 25.01 | 25.01 | 25.01 | 25.01 | 25.01 | 25.01 | 25.01 |
| EBITAT | 162,016.5 | -24,656.4 | 49,252.4 | 420,329.4 | 219,980.0 | 188,895.5 | 203,875.1 | 220,042.6 | 237,492.2 | 256,325.6 |
| Depreciation | ||||||||||
| Changes in Account Receivables | ||||||||||
| Changes in Inventories | ||||||||||
| Changes in Accounts Payable | ||||||||||
| Capital Expenditure | ||||||||||
| UFCF | -3,447.5 | -165,369.4 | -15,176.6 | 226,236.4 | 83,613.0 | 184,645.0 | 102,528.7 | 110,659.4 | 119,434.8 | 128,906.1 |
| WACC, % | 3.38 | 3.85 | 2.88 | 3.45 | 3.34 | 3.38 | 3.38 | 3.38 | 3.38 | 3.38 |
| PV UFCF | ||||||||||
| SUM PV UFCF | 588,451.8 | |||||||||
| Long Term Growth Rate, % | 2.60 | |||||||||
| Free cash flow (T + 1) | 132,258 | |||||||||
| Terminal Value | 16,986,366 | |||||||||
| Present Terminal Value | 14,386,231 | |||||||||
| Enterprise Value | 14,974,683 | |||||||||
| Net Debt | 2,796,455 | |||||||||
| Equity Value | 12,178,228 | |||||||||
| Diluted Shares Outstanding, MM | 756 | |||||||||
| Equity Value Per Share | 16,114.39 |
What You Will Receive
- Genuine 9502T Financial Data: Pre-loaded with Chubu Electric Power Company’s historical and projected figures for accurate analysis.
- Completely Customizable Template: Effortlessly adjust key inputs such as revenue growth, WACC, and EBITDA percentage.
- Instantaneous Calculations: Observe real-time updates of Chubu Electric's intrinsic value based on your modifications.
- Advanced Valuation Tool: Tailored for investors, analysts, and consultants in pursuit of precise DCF results.
- Intuitive Design: Clear layout and straightforward instructions suitable for users of all experience levels.
Key Features
- Pre-Loaded Data: Chubu Electric’s historical financial statements and pre-filled forecasts.
- Fully Adjustable Inputs: Customize WACC, tax rates, revenue growth, and EBITDA margins.
- Instant Results: Watch Chubu Electric's intrinsic value recalculate in real time.
- Clear Visual Outputs: Dashboard charts showcase valuation results and key metrics.
- Built for Accuracy: A professional tool tailored for analysts, investors, and finance professionals.
How It Functions
- Step 1: Download the Excel spreadsheet.
- Step 2: Examine the pre-filled data for Chubu Electric Power Company (9502T), including historical and forecasted figures.
- Step 3: Modify the key assumptions (highlighted in yellow) according to your findings.
- Step 4: Observe the automatic recalculations of Chubu Electric Power Company's (9502T) intrinsic value.
- Step 5: Utilize the results for making investment choices or for reporting purposes.
Why Choose This Calculator for Chubu Electric Power Company (9502T)?
- Reliable Data: Utilize authentic Chubu Electric financials for trustworthy valuation outcomes.
- Customizable Features: Modify essential parameters such as growth rates, WACC, and tax rates to align with your forecasts.
- Efficient: Pre-configured calculations save you time by removing the need to build from the ground up.
- Professional Quality: Tailored for investors, analysts, and consultants in the energy sector.
- Easy to Use: With a straightforward design and clear instructions, this tool is accessible for all users.
Who Should Use This Product?
- Individual Investors: Gain insights to make informed decisions about buying or selling Chubu Electric Power Company (9502T) stock.
- Financial Analysts: Enhance valuation processes with efficient, ready-to-use financial models tailored for Chubu Electric Power Company (9502T).
- Consultants: Provide clients with accurate and timely valuation insights related to Chubu Electric Power Company (9502T).
- Business Owners: Learn about the valuation strategies of major companies like Chubu Electric Power Company (9502T) to inform your own business approach.
- Finance Students: Explore valuation methods using real-world data and case studies involving Chubu Electric Power Company (9502T).
Contents of the Template
- Pre-Filled Data: Contains Chubu Electric Power Company’s historical financial information and projections.
- Discounted Cash Flow Model: An editable DCF valuation model featuring automatic calculation capabilities.
- Weighted Average Cost of Capital (WACC): A separate sheet dedicated to calculating WACC using user-defined inputs.
- Key Financial Ratios: Evaluate Chubu Electric's profitability, efficiency, and financial leverage.
- Customizable Inputs: Easily modify revenue growth, profit margins, and tax rates.
- Clear Dashboard: Visual representations and tables summarizing essential valuation outcomes.
Disclaimer
All information, articles, and product details provided on this website are for general informational and educational purposes only. We do not claim any ownership over, nor do we intend to infringe upon, any trademarks, copyrights, logos, brand names, or other intellectual property mentioned or depicted on this site. Such intellectual property remains the property of its respective owners, and any references here are made solely for identification or informational purposes, without implying any affiliation, endorsement, or partnership.
We make no representations or warranties, express or implied, regarding the accuracy, completeness, or suitability of any content or products presented. Nothing on this website should be construed as legal, tax, investment, financial, medical, or other professional advice. In addition, no part of this site—including articles or product references—constitutes a solicitation, recommendation, endorsement, advertisement, or offer to buy or sell any securities, franchises, or other financial instruments, particularly in jurisdictions where such activity would be unlawful.
All content is of a general nature and may not address the specific circumstances of any individual or entity. It is not a substitute for professional advice or services. Any actions you take based on the information provided here are strictly at your own risk. You accept full responsibility for any decisions or outcomes arising from your use of this website and agree to release us from any liability in connection with your use of, or reliance upon, the content or products found herein.