
|
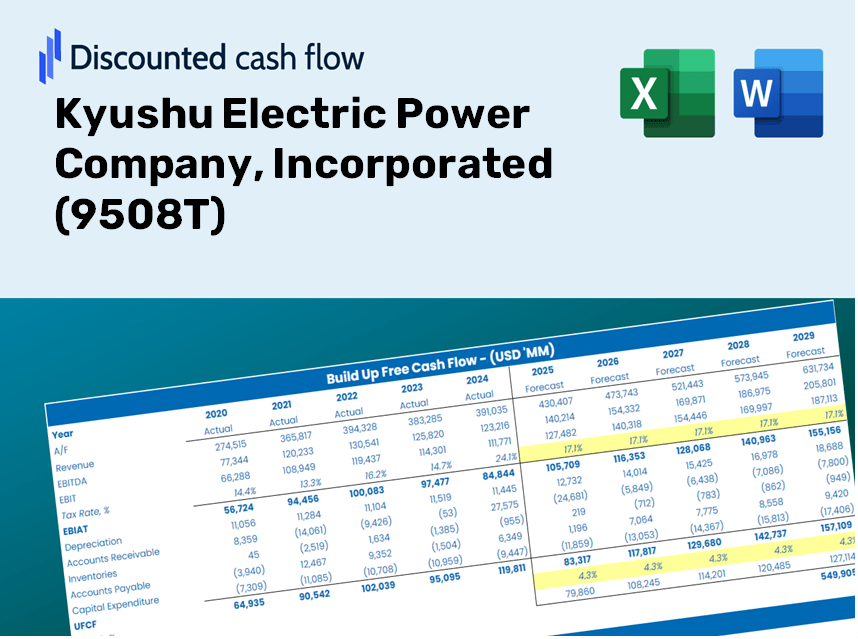
Kyushu Electric Power Company, Incorporated (9508.T) DCF Valuation |
Entièrement Modifiable: Adapté À Vos Besoins Dans Excel Ou Sheets
Conception Professionnelle: Modèles Fiables Et Conformes Aux Normes Du Secteur
Pré-Construits Pour Une Utilisation Rapide Et Efficace
Compatible MAC/PC, entièrement débloqué
Aucune Expertise N'Est Requise; Facile À Suivre
Kyushu Electric Power Company, Incorporated (9508.T) Bundle
Conçu pour la précision, notre (9508T) Calculator DCF vous permet d'évaluer l'évaluation de Kyushu Electric Power Company, incorporée avec des données financières à jour et une flexibilité complète pour modifier les paramètres essentiels pour des projections améliorées.
What Awaits You
- Accurate 9508T Financial Data: Pre-loaded with Kyushu Electric's historical and projected data for thorough analysis.
- Customizable Template: Easily adjust key inputs such as revenue growth, WACC, and EBITDA percentage.
- Instant Calculations: Observe the immediate update of Kyushu Electric's intrinsic value as you make changes.
- Professional Valuation Tool: Tailored for investors, analysts, and consultants who require precise DCF outcomes.
- User-Friendly Interface: Intuitive layout and straightforward instructions suitable for all skill levels.
Key Features
- Comprehensive DCF Calculator: Features in-depth unlevered and levered DCF valuation models tailored for Kyushu Electric Power Company, Incorporated (9508T).
- WACC Calculator: Ready-to-use Weighted Average Cost of Capital sheet with adjustable inputs specific to the company's financial structure.
- Customizable Forecast Assumptions: Easily alter growth rates, capital expenditures, and discount rates to reflect Kyushu Electric’s operational outlook.
- Integrated Financial Ratios: Review key profitability, leverage, and efficiency ratios relevant to Kyushu Electric Power Company, Incorporated (9508T).
- Interactive Dashboard and Charts: Visualize essential valuation metrics for straightforward analysis and decision-making.
How It Works
- 1. Access the Template: Download and open the Excel file containing Kyushu Electric Power Company’s preloaded data.
- 2. Adjust Assumptions: Modify essential inputs such as growth rates, WACC, and capital expenditures to reflect your analysis.
- 3. View Results Immediately: The DCF model automatically computes the intrinsic value and NPV for you.
- 4. Explore Scenarios: Evaluate various forecasts to examine different potential valuation results.
- 5. Utilize with Assurance: Deliver professional valuation insights to aid in your decision-making process.
Why Choose This Calculator for Kyushu Electric Power Company (9508T)?
- User-Friendly Interface: Perfectly tailored for both novices and seasoned users.
- Customizable Inputs: Effortlessly adjust parameters to suit your analysis needs.
- Real-Time Valuation: Witness immediate updates to Kyushu Electric’s valuation with input adjustments.
- Preloaded Financial Data: Comes with Kyushu Electric’s actual financial figures for swift evaluations.
- Relied Upon by Experts: A go-to tool for investors and analysts aiming for informed decision-making.
Who Can Benefit from This Product?
- Investors: Effectively assess Kyushu Electric Power Company’s fair value before making investment choices.
- CFOs: Utilize a top-tier DCF model for precise financial analysis and reporting.
- Consultants: Seamlessly modify the template for client valuation reports.
- Entrepreneurs: Obtain valuable insights into the financial modeling practices of industry leaders.
- Educators: Employ this resource as a teaching aid to illustrate valuation techniques.
What the Template Contains
- Historical Data: Contains Kyushu Electric Power’s past financial performance and foundational forecasts.
- DCF and Levered DCF Models: Comprehensive templates designed to assess the intrinsic value of Kyushu Electric Power.
- WACC Sheet: Pre-calculated metrics for the Weighted Average Cost of Capital.
- Editable Inputs: Adjust essential parameters such as growth rates, EBITDA margins, and CAPEX estimates.
- Quarterly and Annual Statements: A thorough analysis of Kyushu Electric Power’s financial data.
- Interactive Dashboard: A dynamic platform to visualize valuation outcomes and forecasts.
Disclaimer
All information, articles, and product details provided on this website are for general informational and educational purposes only. We do not claim any ownership over, nor do we intend to infringe upon, any trademarks, copyrights, logos, brand names, or other intellectual property mentioned or depicted on this site. Such intellectual property remains the property of its respective owners, and any references here are made solely for identification or informational purposes, without implying any affiliation, endorsement, or partnership.
We make no representations or warranties, express or implied, regarding the accuracy, completeness, or suitability of any content or products presented. Nothing on this website should be construed as legal, tax, investment, financial, medical, or other professional advice. In addition, no part of this site—including articles or product references—constitutes a solicitation, recommendation, endorsement, advertisement, or offer to buy or sell any securities, franchises, or other financial instruments, particularly in jurisdictions where such activity would be unlawful.
All content is of a general nature and may not address the specific circumstances of any individual or entity. It is not a substitute for professional advice or services. Any actions you take based on the information provided here are strictly at your own risk. You accept full responsibility for any decisions or outcomes arising from your use of this website and agree to release us from any liability in connection with your use of, or reliance upon, the content or products found herein.