
|
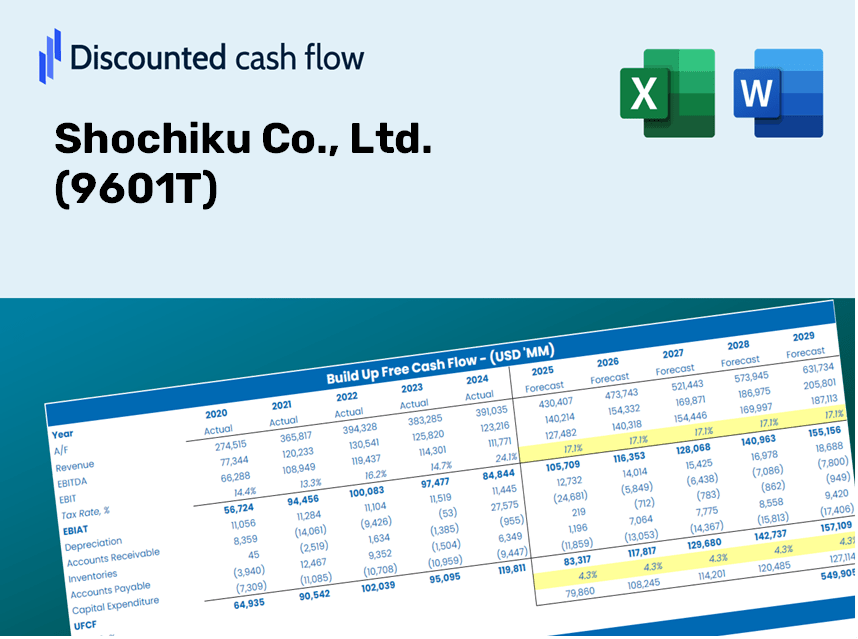
Shochiku Co., Ltd. (9601.T) Évaluation DCF |
Entièrement Modifiable: Adapté À Vos Besoins Dans Excel Ou Sheets
Conception Professionnelle: Modèles Fiables Et Conformes Aux Normes Du Secteur
Pré-Construits Pour Une Utilisation Rapide Et Efficace
Compatible MAC/PC, entièrement débloqué
Aucune Expertise N'Est Requise; Facile À Suivre
Shochiku Co., Ltd. (9601.T) Bundle
Optimisez votre temps et améliorez la précision avec notre (9601T) Calculator DCF! En utilisant Real Shochiku Co., Ltd. Données et hypothèses personnalisables, cet outil vous permet de prévoir, analyser et valoriser Shochiku Co., Ltd. comme un investisseur chevronné.
Benefits You Will Receive
- Authentic Shochiku Financials: Access to historical and projected data for precise valuation.
- Customizable Inputs: Adjust parameters such as WACC, tax rates, revenue growth, and capital expenditures.
- Automated Calculations: Intrinsic value and NPV are computed in real-time.
- Scenario Analysis: Explore various scenarios to assess Shochiku's future performance.
- User-Friendly Design: Crafted for industry professionals but easy to navigate for newcomers.
Company: Shochiku Co., Ltd. ([9601T])
Key Features
- Authentic Shochiku Data: Pre-loaded with Shochiku Co., Ltd.'s historical financials and future forecasts.
- Completely Customizable Inputs: Modify assumptions for revenue growth, profit margins, discount rates, tax rates, and capital expenditures.
- Interactive Valuation Model: Automatic recalculations of Net Present Value (NPV) and intrinsic value based on your specified parameters.
- Scenario Analysis: Develop various forecast scenarios to evaluate different valuation possibilities.
- Intuitive User Interface: Designed to be accessible for both industry professionals and newcomers.
How It Functions
- Step 1: Download the Excel file.
- Step 2: Examine the pre-filled Shochiku Co., Ltd. (9601T) data (historical and projected).
- Step 3: Modify key assumptions (highlighted in yellow) according to your insights.
- Step 4: Observe the automatic recalculations for Shochiku Co., Ltd.'s intrinsic value.
- Step 5: Utilize the results for your investment strategies or reporting purposes.
Why Choose This Calculator for Shochiku Co., Ltd. (9601T)?
- Reliable Information: Utilize authentic financial data from Shochiku Co., Ltd. for trustworthy valuation outcomes.
- Flexible Settings: Tailor critical variables such as growth projections, WACC, and tax rates to suit your specific forecasts.
- Efficiency Boost: Built-in calculations save you time by removing the need for initial setup.
- Expert-Level Tool: Crafted for the needs of investors, analysts, and financial consultants.
- Easy to Navigate: Simple design and clear instructions ensure accessibility for all users.
Who Can Benefit from This Product?
- Investors: Accurately assess the fair value of Shochiku Co., Ltd. (9601T) prior to making investment choices.
- CFOs: Utilize a sophisticated DCF model for enhanced financial reporting and analysis.
- Consultants: Quickly modify the template for valuation reports tailored to clients.
- Entrepreneurs: Obtain insights into financial modeling practices employed by leading companies.
- Educators: Employ it as a resource to teach valuation techniques and methodologies.
Contents of the Template
- Operating and Balance Sheet Data: Pre-filled historical data and forecasts for Shochiku Co., Ltd. (9601T), including revenue, EBITDA, EBIT, and capital expenditures.
- WACC Calculation: A dedicated sheet for the Weighted Average Cost of Capital (WACC), featuring parameters such as Beta, risk-free rate, and share price.
- DCF Valuation (Unlevered and Levered): Customizable Discounted Cash Flow models that present intrinsic value along with detailed calculations.
- Financial Statements: Pre-loaded financial statements (annual and quarterly) to facilitate comprehensive analysis.
- Key Ratios: A collection of profitability, leverage, and efficiency ratios specific to Shochiku Co., Ltd. (9601T).
- Dashboard and Charts: A visual summary of valuation outputs and assumptions for easy analysis of results.
Disclaimer
All information, articles, and product details provided on this website are for general informational and educational purposes only. We do not claim any ownership over, nor do we intend to infringe upon, any trademarks, copyrights, logos, brand names, or other intellectual property mentioned or depicted on this site. Such intellectual property remains the property of its respective owners, and any references here are made solely for identification or informational purposes, without implying any affiliation, endorsement, or partnership.
We make no representations or warranties, express or implied, regarding the accuracy, completeness, or suitability of any content or products presented. Nothing on this website should be construed as legal, tax, investment, financial, medical, or other professional advice. In addition, no part of this site—including articles or product references—constitutes a solicitation, recommendation, endorsement, advertisement, or offer to buy or sell any securities, franchises, or other financial instruments, particularly in jurisdictions where such activity would be unlawful.
All content is of a general nature and may not address the specific circumstances of any individual or entity. It is not a substitute for professional advice or services. Any actions you take based on the information provided here are strictly at your own risk. You accept full responsibility for any decisions or outcomes arising from your use of this website and agree to release us from any liability in connection with your use of, or reliance upon, the content or products found herein.