
|
Square Enix Holdings Co., Ltd. (9684.T) Évaluation DCF |
Entièrement Modifiable: Adapté À Vos Besoins Dans Excel Ou Sheets
Conception Professionnelle: Modèles Fiables Et Conformes Aux Normes Du Secteur
Pré-Construits Pour Une Utilisation Rapide Et Efficace
Compatible MAC/PC, entièrement débloqué
Aucune Expertise N'Est Requise; Facile À Suivre
Square Enix Holdings Co., Ltd. (9684.T) Bundle
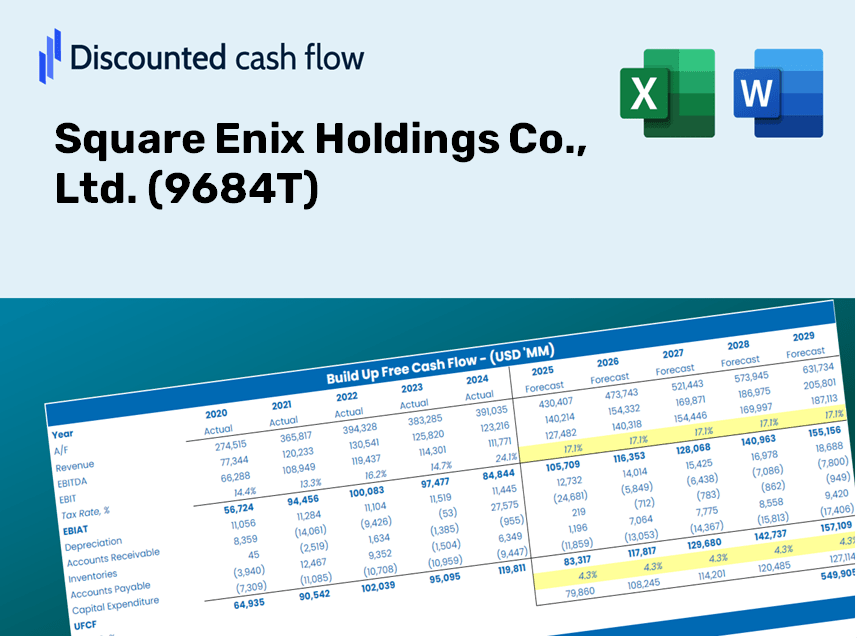
Que vous soyez un investisseur ou un analyste, ce (9684t) Calculator DCF est votre outil de référence pour une évaluation précise. Équipé de données réelles de Square Enix Holdings Co., Ltd., vous pouvez ajuster les prévisions et observer les effets en temps réel.
What You Will Receive
- Customizable Excel Template: A fully adaptable Excel-based DCF Calculator featuring pre-filled actual financials for Square Enix Holdings Co., Ltd. (9684T).
- Authentic Data: Access to historical data and future projections (highlighted in the yellow cells).
- Flexible Forecasting: Adjust forecast variables such as revenue growth, EBITDA %, and WACC.
- Instant Calculations: Quickly observe how your inputs affect Square Enix's valuation.
- Professional Resource: Designed for investors, CFOs, consultants, and financial analysts.
- Intuitive Layout: Organized for simplicity and ease of use, complete with step-by-step guidance.
Key Features
- Comprehensive SEH Data: Pre-populated with Square Enix's historical financial metrics and future projections.
- Customizable Parameters: Fine-tune revenue growth, profit margins, WACC, tax rates, and capital expenditure estimates.
- Interactive Valuation Model: Instantaneous updates to Net Present Value (NPV) and intrinsic value based on your inputs.
- Scenario Analysis: Develop various forecasting scenarios to evaluate different valuation possibilities.
- User-Centric Interface: Intuitive and organized, suitable for both seasoned professionals and newcomers.
How It Functions
- 1. Access the Template: Download and launch the Excel file featuring Square Enix's preloaded data.
- 2. Modify Assumptions: Adjust essential parameters such as growth rates, WACC, and capital expenditures.
- 3. Instant Result Analysis: The DCF model automatically calculates the intrinsic value and NPV.
- 4. Explore Scenarios: Evaluate various forecasts to investigate different valuation possibilities.
- 5. Present with Assurance: Share professional valuation insights to inform your decision-making process.
Why Choose This Calculator for Square Enix Holdings Co., Ltd. (9684T)?
- Precision: Leverages actual Square Enix financial data for reliable insights.
- Adaptability: Built for users to easily experiment with and adjust inputs.
- Efficiency: Avoid the complexities of constructing a DCF model from the ground up.
- Expert-Level: Crafted with the accuracy and functionality expected by CFOs.
- Intuitive: Simple to navigate, even for those with limited financial modeling skills.
Who Can Benefit from This Product?
- Individual Investors: Make well-informed choices regarding the purchase or sale of Square Enix Holdings Co., Ltd. (9684T) stock.
- Financial Analysts: Enhance valuation workflows with accessible financial models tailored for the gaming industry.
- Consultants: Provide clients with precise valuation insights regarding Square Enix Holdings Co., Ltd. (9684T) in a timely manner.
- Business Owners: Gain an understanding of how major companies like Square Enix Holdings Co., Ltd. (9684T) are valued to inform your strategic decisions.
- Finance Students: Explore valuation methodologies using real-world data and scenarios related to the gaming sector.
What the Template Contains
- Pre-Filled DCF Model: Square Enix's financial data preloaded for immediate use.
- WACC Calculator: Detailed calculations for Weighted Average Cost of Capital.
- Financial Ratios: Assess Square Enix's profitability, leverage, and efficiency.
- Editable Inputs: Modify assumptions like growth rates, margins, and CAPEX to suit your scenarios.
- Financial Statements: Annual and quarterly reports to facilitate in-depth analysis.
- Interactive Dashboard: Easily visualize essential valuation metrics and outcomes.
Disclaimer
All information, articles, and product details provided on this website are for general informational and educational purposes only. We do not claim any ownership over, nor do we intend to infringe upon, any trademarks, copyrights, logos, brand names, or other intellectual property mentioned or depicted on this site. Such intellectual property remains the property of its respective owners, and any references here are made solely for identification or informational purposes, without implying any affiliation, endorsement, or partnership.
We make no representations or warranties, express or implied, regarding the accuracy, completeness, or suitability of any content or products presented. Nothing on this website should be construed as legal, tax, investment, financial, medical, or other professional advice. In addition, no part of this site—including articles or product references—constitutes a solicitation, recommendation, endorsement, advertisement, or offer to buy or sell any securities, franchises, or other financial instruments, particularly in jurisdictions where such activity would be unlawful.
All content is of a general nature and may not address the specific circumstances of any individual or entity. It is not a substitute for professional advice or services. Any actions you take based on the information provided here are strictly at your own risk. You accept full responsibility for any decisions or outcomes arising from your use of this website and agree to release us from any liability in connection with your use of, or reliance upon, the content or products found herein.