
|
Tuhu Car Inc (9690.HK) Évaluation DCF |
Entièrement Modifiable: Adapté À Vos Besoins Dans Excel Ou Sheets
Conception Professionnelle: Modèles Fiables Et Conformes Aux Normes Du Secteur
Pré-Construits Pour Une Utilisation Rapide Et Efficace
Compatible MAC/PC, entièrement débloqué
Aucune Expertise N'Est Requise; Facile À Suivre
TUHU Car Inc (9690.HK) Bundle
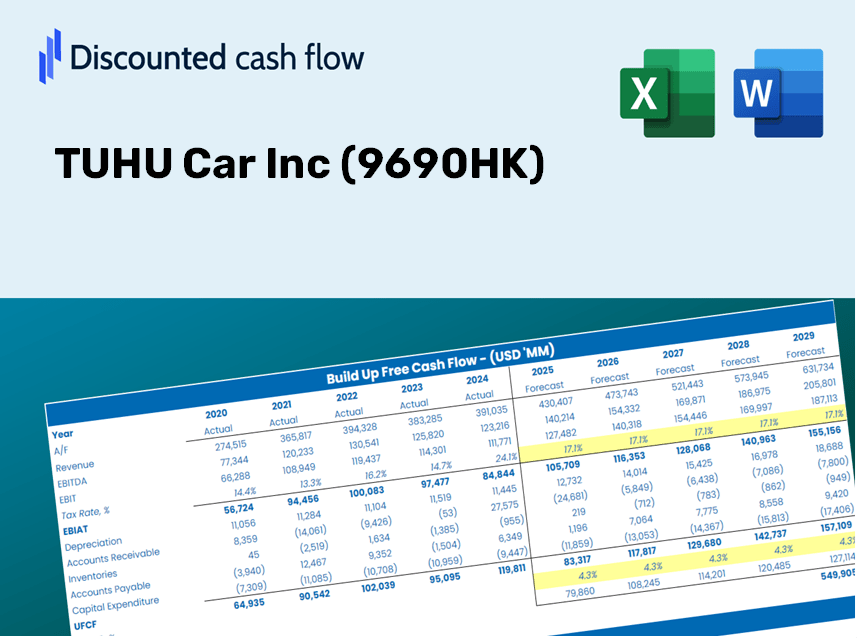
Explorez le potentiel financier de Tuhu Car Inc (9690HK) avec notre calculatrice DCF conviviale! Entrez vos projections pour la croissance, les marges et les dépenses pour déterminer la valeur intrinsèque de Tuhu Car Inc (9690HK) et améliorer votre stratégie d'investissement.
Discounted Cash Flow (DCF) - (USD MM)
| Year | AY1 2020 |
AY2 2021 |
AY3 2022 |
AY4 2023 |
AY5 2024 |
FY1 2025 |
FY2 2026 |
FY3 2027 |
FY4 2028 |
FY5 2029 |
|---|---|---|---|---|---|---|---|---|---|---|
| Revenue | 9,560.2 | 12,805.0 | 12,611.2 | 14,854.8 | 16,119.2 | 18,485.8 | 21,200.0 | 24,312.6 | 27,882.2 | 31,976.0 |
| Revenue Growth, % | 0 | 33.94 | -1.51 | 17.79 | 8.51 | 14.68 | 14.68 | 14.68 | 14.68 | 14.68 |
| EBITDA | -3,947.3 | -5,949.7 | -1,874.2 | 7,760.7 | 524.3 | -1,742.0 | -1,997.8 | -2,291.1 | -2,627.5 | -3,013.3 |
| EBITDA, % | -41.29 | -46.46 | -14.86 | 52.24 | 3.25 | -9.42 | -9.42 | -9.42 | -9.42 | -9.42 |
| Depreciation | 261.0 | 332.6 | 397.3 | 394.8 | 176.0 | 452.1 | 518.5 | 594.6 | 681.9 | 782.0 |
| Depreciation, % | 2.73 | 2.6 | 3.15 | 2.66 | 1.09 | 2.45 | 2.45 | 2.45 | 2.45 | 2.45 |
| EBIT | -4,208.3 | -6,282.3 | -2,271.5 | 7,365.8 | 348.3 | -2,194.1 | -2,516.2 | -2,885.7 | -3,309.4 | -3,795.2 |
| EBIT, % | -44.02 | -49.06 | -18.01 | 49.59 | 2.16 | -11.87 | -11.87 | -11.87 | -11.87 | -11.87 |
| Total Cash | 2,028.5 | 1,957.9 | 3,523.8 | 4,699.0 | 4,859.4 | 4,666.9 | 5,352.1 | 6,138.0 | 7,039.2 | 8,072.7 |
| Total Cash, percent | .0 | .0 | .0 | .0 | .0 | .0 | .0 | .0 | .0 | .0 |
| Account Receivables | 306.4 | 221.7 | 189.7 | 238.3 | 247.0 | 354.1 | 406.1 | 465.7 | 534.0 | 612.5 |
| Account Receivables, % | 3.2 | 1.73 | 1.5 | 1.6 | 1.53 | 1.92 | 1.92 | 1.92 | 1.92 | 1.92 |
| Inventories | 1,955.5 | 2,071.3 | 1,856.9 | 2,150.8 | 2,314.0 | 2,964.7 | 3,400.0 | 3,899.2 | 4,471.7 | 5,128.2 |
| Inventories, % | 20.45 | 16.18 | 14.72 | 14.48 | 14.36 | 16.04 | 16.04 | 16.04 | 16.04 | 16.04 |
| Accounts Payable | 880.5 | 1,200.0 | 882.6 | 4,245.0 | 4,868.5 | 3,118.9 | 3,576.8 | 4,102.0 | 4,704.3 | 5,395.0 |
| Accounts Payable, % | 9.21 | 9.37 | 7 | 28.58 | 30.2 | 16.87 | 16.87 | 16.87 | 16.87 | 16.87 |
| Capital Expenditure | -183.8 | -378.8 | -437.6 | -395.4 | -351.3 | -487.7 | -559.3 | -641.4 | -735.6 | -843.6 |
| Capital Expenditure, % | -1.92 | -2.96 | -3.47 | -2.66 | -2.18 | -2.64 | -2.64 | -2.64 | -2.64 | -2.64 |
| Tax Rate, % | 0.69767 | 0.69767 | 0.69767 | 0.69767 | 0.69767 | 0.69767 | 0.69767 | 0.69767 | 0.69767 | 0.69767 |
| EBITAT | -4,234.8 | -6,315.4 | -2,302.2 | 7,341.3 | 345.8 | -2,189.6 | -2,511.0 | -2,879.7 | -3,302.5 | -3,787.4 |
| Depreciation | ||||||||||
| Changes in Account Receivables | ||||||||||
| Changes in Inventories | ||||||||||
| Changes in Accounts Payable | ||||||||||
| Capital Expenditure | ||||||||||
| UFCF | -5,538.9 | -6,073.1 | -2,413.6 | 10,360.8 | 622.1 | -4,732.6 | -2,581.2 | -2,960.2 | -3,394.9 | -3,893.3 |
| WACC, % | 4.69 | 4.69 | 4.69 | 4.69 | 4.69 | 4.69 | 4.69 | 4.69 | 4.69 | 4.69 |
| PV UFCF | ||||||||||
| SUM PV UFCF | -15,377.0 | |||||||||
| Long Term Growth Rate, % | 2.00 | |||||||||
| Free cash flow (T + 1) | -3,971 | |||||||||
| Terminal Value | -147,530 | |||||||||
| Present Terminal Value | -117,306 | |||||||||
| Enterprise Value | -132,683 | |||||||||
| Net Debt | -1,162 | |||||||||
| Equity Value | -131,521 | |||||||||
| Diluted Shares Outstanding, MM | 837 | |||||||||
| Equity Value Per Share | -157.19 |
What You'll Receive
- Customizable Excel Template: A fully adjustable Excel-based DCF Calculator featuring pre-filled real TUHU Car Inc (9690HK) financial data.
- Authentic Data: Historical figures and forward-looking projections (highlighted in the yellow cells).
- Adjustable Forecasts: Modify assumptions for revenue growth, EBITDA %, and WACC according to your needs.
- Instant Calculations: Quickly observe how your inputs affect the valuation of TUHU Car Inc (9690HK).
- Professional Resource: Designed for investors, CFOs, consultants, and financial analysts alike.
- User-Friendly Interface: Intuitively organized for clarity and simplicity, complete with step-by-step guidance.
Key Features
- Accurate TUHU Financial Data: Gain access to reliable historical records and future forecasts tailored for TUHU Car Inc (9690HK).
- Flexible Forecast Parameters: Modify highlighted fields, including WACC, growth rates, and profit margins, to fit your analysis.
- Real-Time Calculations: Enjoy automatic updates for DCF, Net Present Value (NPV), and cash flow evaluations.
- Interactive Dashboard: Utilize user-friendly charts and summaries to effectively visualize your valuation findings.
- Designed for All Skill Levels: A straightforward, user-friendly layout catering to investors, CFOs, and consultants alike.
How It Functions
- Step 1: Download the Excel file.
- Step 2: Examine the pre-filled data for TUHU Car Inc (9690HK) (historical and projected).
- Step 3: Modify the key assumptions (highlighted in yellow) according to your analysis.
- Step 4: Observe the automatic recalculations reflecting TUHU Car Inc's (9690HK) intrinsic value.
- Step 5: Utilize the results for your investment choices or reporting needs.
Why Choose TUHU Car Inc (9690HK) Calculator?
- Precision: Leveraging authentic TUHU Car Inc financials to ensure precise data.
- Adaptability: Built for users to experiment with and adjust inputs effortlessly.
- Efficiency: Eliminate the need to create a DCF model from the ground up.
- Expert-Level: Crafted with the accuracy and usability suited for CFOs.
- Accessible: Intuitive design allows easy navigation for users with varying financial backgrounds.
Who Can Benefit from TUHU Car Inc (9690HK)?
- Investors: Gain the insights you need to make informed decisions with our advanced valuation tools.
- Financial Analysts: Streamline your workflow with our customizable DCF model designed for efficiency.
- Consultants: Effortlessly modify the template for impactful client presentations or comprehensive reports.
- Finance Enthusiasts: Enhance your comprehension of valuation strategies through practical, real-world examples.
- Educators and Students: Utilize our resources as an effective learning aid in finance-focused curricula.
Contents of the Template
- Historical Data: Contains TUHU Car Inc's past financial information and baseline forecasts.
- DCF and Levered DCF Models: Comprehensive templates for calculating the intrinsic value of TUHU Car Inc (9690HK).
- WACC Sheet: Pre-formulated calculations for Weighted Average Cost of Capital.
- Editable Inputs: Adjust key variables such as growth rates, EBITDA percentages, and CAPEX assumptions.
- Quarterly and Annual Statements: An extensive overview of TUHU Car Inc's financials.
- Interactive Dashboard: Dynamically visualize valuation outcomes and future projections.
Disclaimer
All information, articles, and product details provided on this website are for general informational and educational purposes only. We do not claim any ownership over, nor do we intend to infringe upon, any trademarks, copyrights, logos, brand names, or other intellectual property mentioned or depicted on this site. Such intellectual property remains the property of its respective owners, and any references here are made solely for identification or informational purposes, without implying any affiliation, endorsement, or partnership.
We make no representations or warranties, express or implied, regarding the accuracy, completeness, or suitability of any content or products presented. Nothing on this website should be construed as legal, tax, investment, financial, medical, or other professional advice. In addition, no part of this site—including articles or product references—constitutes a solicitation, recommendation, endorsement, advertisement, or offer to buy or sell any securities, franchises, or other financial instruments, particularly in jurisdictions where such activity would be unlawful.
All content is of a general nature and may not address the specific circumstances of any individual or entity. It is not a substitute for professional advice or services. Any actions you take based on the information provided here are strictly at your own risk. You accept full responsibility for any decisions or outcomes arising from your use of this website and agree to release us from any liability in connection with your use of, or reliance upon, the content or products found herein.