
|
Aeon Delight Co., Ltd. (9787.T) Évaluation DCF |
Entièrement Modifiable: Adapté À Vos Besoins Dans Excel Ou Sheets
Conception Professionnelle: Modèles Fiables Et Conformes Aux Normes Du Secteur
Pré-Construits Pour Une Utilisation Rapide Et Efficace
Compatible MAC/PC, entièrement débloqué
Aucune Expertise N'Est Requise; Facile À Suivre
Aeon Delight Co., Ltd. (9787.T) Bundle
Évaluez les perspectives financières d'Aeon Delight Co., Ltd. (9787T) comme un professionnel! Ce (9787T) Calculator DCF est livré avec des finances pré-remplies et une pleine flexibilité pour modifier la croissance des revenus, le WACC, les marges et d'autres hypothèses essentielles pour faire correspondre vos projections.
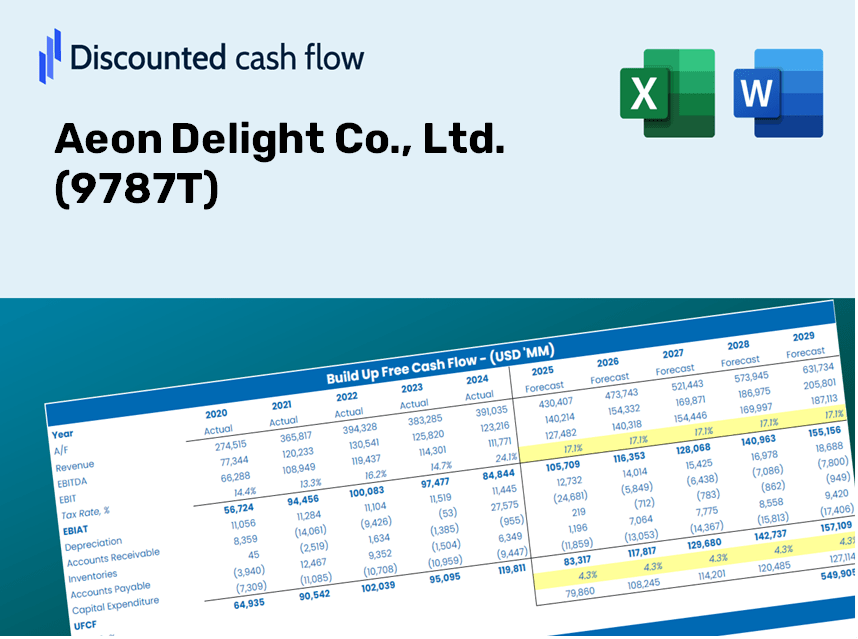
Discounted Cash Flow (DCF) - (USD MM)
| Year | AY1 2020 |
AY2 2021 |
AY3 2022 |
AY4 2023 |
AY5 2024 |
FY1 2025 |
FY2 2026 |
FY3 2027 |
FY4 2028 |
FY5 2029 |
|---|---|---|---|---|---|---|---|---|---|---|
| Revenue | 300,085.0 | 317,657.0 | 303,776.0 | 324,820.0 | 337,929.0 | 348,446.3 | 359,290.9 | 370,473.0 | 382,003.2 | 393,892.2 |
| Revenue Growth, % | 0 | 5.86 | -4.37 | 6.93 | 4.04 | 3.11 | 3.11 | 3.11 | 3.11 | 3.11 |
| EBITDA | 18,458.0 | 19,212.0 | 19,106.0 | 19,405.0 | 20,163.0 | 21,205.9 | 21,865.9 | 22,546.4 | 23,248.1 | 23,971.6 |
| EBITDA, % | 6.15 | 6.05 | 6.29 | 5.97 | 5.97 | 6.09 | 6.09 | 6.09 | 6.09 | 6.09 |
| Depreciation | 3,228.0 | 3,477.0 | 3,291.0 | 3,798.0 | 3,865.0 | 3,879.3 | 4,000.1 | 4,124.6 | 4,252.9 | 4,385.3 |
| Depreciation, % | 1.08 | 1.09 | 1.08 | 1.17 | 1.14 | 1.11 | 1.11 | 1.11 | 1.11 | 1.11 |
| EBIT | 15,230.0 | 15,735.0 | 15,815.0 | 15,607.0 | 16,298.0 | 17,326.5 | 17,865.8 | 18,421.8 | 18,995.1 | 19,586.3 |
| EBIT, % | 5.08 | 4.95 | 5.21 | 4.8 | 4.82 | 4.97 | 4.97 | 4.97 | 4.97 | 4.97 |
| Total Cash | 59,773.0 | 68,282.0 | 64,608.0 | 76,253.0 | 80,165.0 | 76,574.8 | 78,958.1 | 81,415.5 | 83,949.3 | 86,562.1 |
| Total Cash, percent | .0 | .0 | .0 | .0 | .0 | .0 | .0 | .0 | .0 | .0 |
| Account Receivables | 42,146.0 | 44,794.0 | 55,795.0 | 56,592.0 | 61,095.0 | 57,155.7 | 58,934.5 | 60,768.7 | 62,660.0 | 64,610.2 |
| Account Receivables, % | 14.04 | 14.1 | 18.37 | 17.42 | 18.08 | 16.4 | 16.4 | 16.4 | 16.4 | 16.4 |
| Inventories | 2,006.0 | 2,074.0 | 2,363.0 | 2,858.0 | 2,874.0 | 2,668.8 | 2,751.9 | 2,837.5 | 2,925.8 | 3,016.9 |
| Inventories, % | 0.66848 | 0.65291 | 0.77788 | 0.87987 | 0.85047 | 0.76592 | 0.76592 | 0.76592 | 0.76592 | 0.76592 |
| Accounts Payable | 22,170.0 | 22,070.0 | 25,901.0 | 34,959.0 | 34,856.0 | 30,620.9 | 31,573.9 | 32,556.6 | 33,569.8 | 34,614.6 |
| Accounts Payable, % | 7.39 | 6.95 | 8.53 | 10.76 | 10.31 | 8.79 | 8.79 | 8.79 | 8.79 | 8.79 |
| Capital Expenditure | -2,469.0 | -3,478.0 | -3,009.0 | -3,613.0 | -2,853.0 | -3,390.2 | -3,495.7 | -3,604.5 | -3,716.7 | -3,832.4 |
| Capital Expenditure, % | -0.82277 | -1.09 | -0.99053 | -1.11 | -0.84426 | -0.97295 | -0.97295 | -0.97295 | -0.97295 | -0.97295 |
| Tax Rate, % | 29.12 | 29.12 | 29.12 | 29.12 | 29.12 | 29.12 | 29.12 | 29.12 | 29.12 | 29.12 |
| EBITAT | 16,701.4 | 10,260.7 | 10,307.1 | 10,726.2 | 11,551.9 | 12,821.2 | 13,220.3 | 13,631.7 | 14,056.0 | 14,493.5 |
| Depreciation | ||||||||||
| Changes in Account Receivables | ||||||||||
| Changes in Inventories | ||||||||||
| Changes in Accounts Payable | ||||||||||
| Capital Expenditure | ||||||||||
| UFCF | -4,521.6 | 7,443.7 | 3,130.1 | 18,677.2 | 7,941.9 | 13,219.8 | 12,815.7 | 13,214.6 | 13,625.9 | 14,049.9 |
| WACC, % | 4.9 | 4.9 | 4.9 | 4.9 | 4.9 | 4.9 | 4.9 | 4.9 | 4.9 | 4.9 |
| PV UFCF | ||||||||||
| SUM PV UFCF | 58,011.6 | |||||||||
| Long Term Growth Rate, % | 2.00 | |||||||||
| Free cash flow (T + 1) | 14,331 | |||||||||
| Terminal Value | 494,279 | |||||||||
| Present Terminal Value | 389,142 | |||||||||
| Enterprise Value | 447,154 | |||||||||
| Net Debt | -71,504 | |||||||||
| Equity Value | 518,658 | |||||||||
| Diluted Shares Outstanding, MM | 48 | |||||||||
| Equity Value Per Share | 10,763.59 |
What You Will Receive
- Authentic (9787T) Financial Data: Pre-loaded with Aeon Delight's historical and forecasted figures for accurate analysis.
- Completely Customizable Template: Easily adjust essential metrics such as revenue growth, WACC, and EBITDA %.
- Instant Calculations: Watch as the intrinsic value of Aeon Delight updates in real-time based on your adjustments.
- Professional Valuation Tool: Crafted for investors, analysts, and consultants seeking precise DCF outcomes.
- User-Friendly Interface: Intuitive layout and straightforward directions suitable for all skill levels.
Key Features
- Accurate Financial Data: Gain access to precise pre-loaded historical figures and future forecasts for Aeon Delight Co., Ltd. (9787T).
- Tailorable Forecast Inputs: Modify the highlighted fields for assumptions like WACC, growth rates, and profit margins.
- Real-Time Calculations: Automatic adjustments for DCF, Net Present Value (NPV), and cash flow analyses.
- User-Friendly Dashboard: Clear charts and summaries designed to help you visualize your valuation outcomes.
- Designed for All Skill Levels: An intuitive layout catering to investors, CFOs, and consultants, both novice and experienced.
How It Functions
- Download the Template: Gain immediate access to the Excel-based Aeon Delight DCF Calculator.
- Input Your Assumptions: Modify the yellow-highlighted cells for growth projections, WACC, profit margins, and more.
- Instant Calculations: The model automatically refreshes Aeon Delight’s intrinsic value.
- Test Scenarios: Explore various assumptions to assess potential valuation shifts.
- Analyze and Decide: Utilize the findings to inform your investment or financial evaluations.
Why Choose the Aeon Delight Calculator?
- Accuracy: Utilize real financial data from Aeon Delight Co., Ltd. for precise calculations.
- Flexibility: Tailored for users to easily adjust and test various inputs.
- Time-Saving: Eliminate the need to create a DCF model from the ground up.
- Professional-Grade: Crafted with the expertise and attention to detail expected by CFOs.
- User-Friendly: Intuitive design ensures accessibility for users without extensive financial modeling skills.
Who Can Benefit from Aeon Delight Co., Ltd. (9787T)?
- Finance Students: Discover valuation methods and apply them using real-world data.
- Academics: Integrate professional valuation models into your teaching or research projects.
- Investors: Validate your investment strategies and analyze the valuation metrics for Aeon Delight Co., Ltd. (9787T).
- Analysts: Optimize your analysis process with a customizable DCF model designed for ease of use.
- Small Business Owners: Understand the valuation techniques used to assess large companies like Aeon Delight Co., Ltd. (9787T).
Contents of the Template
- Preloaded 9787T Data: Historical and forecasted financial metrics, including revenue, EBIT, and capital expenditures.
- DCF and WACC Models: High-quality templates for calculating intrinsic value and Weighted Average Cost of Capital.
- Editable Inputs: Yellow-highlighted fields for modifying revenue growth, tax rates, and discount rates.
- Financial Statements: Detailed annual and quarterly financial reports for in-depth analysis.
- Key Ratios: Metrics for profitability, leverage, and efficiency to assess performance.
- Dashboard and Charts: Visual representations of valuation results and underlying assumptions.
Disclaimer
All information, articles, and product details provided on this website are for general informational and educational purposes only. We do not claim any ownership over, nor do we intend to infringe upon, any trademarks, copyrights, logos, brand names, or other intellectual property mentioned or depicted on this site. Such intellectual property remains the property of its respective owners, and any references here are made solely for identification or informational purposes, without implying any affiliation, endorsement, or partnership.
We make no representations or warranties, express or implied, regarding the accuracy, completeness, or suitability of any content or products presented. Nothing on this website should be construed as legal, tax, investment, financial, medical, or other professional advice. In addition, no part of this site—including articles or product references—constitutes a solicitation, recommendation, endorsement, advertisement, or offer to buy or sell any securities, franchises, or other financial instruments, particularly in jurisdictions where such activity would be unlawful.
All content is of a general nature and may not address the specific circumstances of any individual or entity. It is not a substitute for professional advice or services. Any actions you take based on the information provided here are strictly at your own risk. You accept full responsibility for any decisions or outcomes arising from your use of this website and agree to release us from any liability in connection with your use of, or reliance upon, the content or products found herein.