
|
Belc co., Ltd. (9974.t) Évaluation DCF |
Entièrement Modifiable: Adapté À Vos Besoins Dans Excel Ou Sheets
Conception Professionnelle: Modèles Fiables Et Conformes Aux Normes Du Secteur
Pré-Construits Pour Une Utilisation Rapide Et Efficace
Compatible MAC/PC, entièrement débloqué
Aucune Expertise N'Est Requise; Facile À Suivre
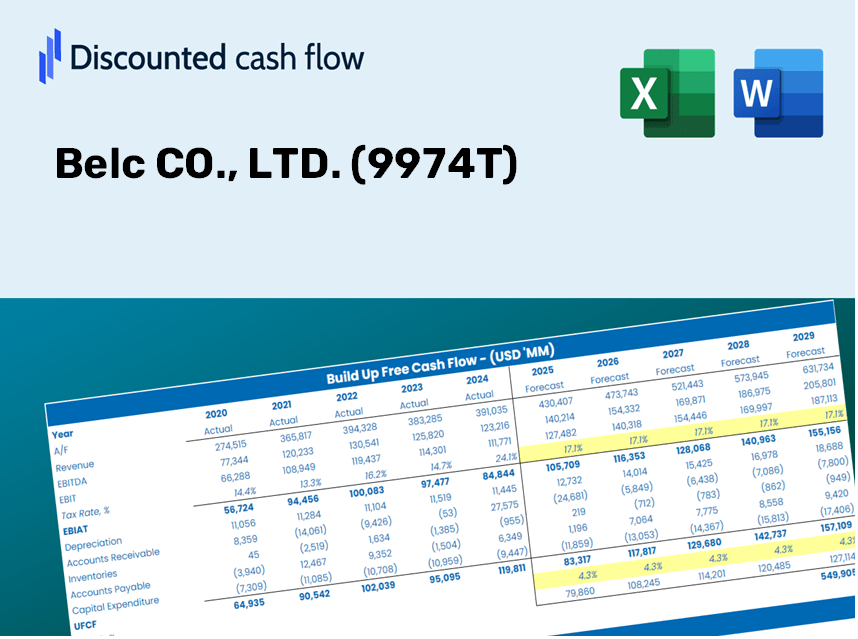
Belc CO., LTD. (9974.T) Bundle
Découvrez la vraie valeur de Belc CO., Ltd. (9974t) avec notre calculatrice DCF de qualité professionnelle! Ajustez les hypothèses clés, explorez divers scénarios et évaluez comment les changements affectent l'évaluation de Belc CO., Ltd. (9974T) - le tout dans un seul modèle Excel.
What You Will Receive
- Customizable Excel Template: An Excel-based DCF Calculator featuring pre-filled financials for Belc CO., LTD. (9974T).
- Accurate Financial Data: Access to historical figures and forward-looking projections (highlighted in the yellow cells).
- Adjustable Forecasting: Modify key assumptions such as sales growth, EBITDA margin, and WACC.
- Instant Calculation Updates: Quickly assess how your inputs affect the valuation of Belc CO., LTD. (9974T).
- Professional Resource: Designed for use by investors, CFOs, consultants, and financial analysts.
- User-Centric Layout: Organized for straightforward navigation and ease of use, complete with step-by-step guidance.
Key Features
- Customizable Forecast Inputs: Adjust essential factors such as sales growth, profit margins, and investment expenditures.
- Instant DCF Valuation: Quickly computes intrinsic value, net present value (NPV), and additional financial metrics.
- High-Precision Accuracy: Leverages Belc CO., LTD.’s actual financial data for dependable valuation results.
- Effortless Scenario Analysis: Easily explore various assumptions and analyze their impact on financial outcomes.
- Efficiency Booster: Streamline your workflow by avoiding the creation of intricate valuation models from the ground up.
How It Operates
- Download the Template: Gain immediate access to the Excel-based Belc CO., LTD. (9974T) DCF Calculator.
- Input Your Assumptions: Modify the yellow-highlighted cells for growth rates, WACC, profit margins, and more.
- Instant Calculations: The model automatically recalculates Belc's intrinsic value.
- Test Scenarios: Experiment with various assumptions to assess potential changes in valuation.
- Analyze and Decide: Leverage the results to inform your investment or financial evaluations.
Why Choose Belc CO., LTD. (9974T) Calculator?
- Time-Saving: Eliminate the hassle of building a DCF model from the ground up – it’s ready for immediate use.
- Enhanced Accuracy: Dependable financial data and proven formulas minimize valuation errors.
- Completely Customizable: Adjust the model to align with your unique assumptions and forecasts.
- User-Friendly: Intuitive charts and outputs simplify the analysis of results.
- Preferred by Professionals: Crafted for experts who prioritize both accuracy and ease of use.
Who Can Benefit from Belc CO., LTD. (9974T)?
- Investors: Evaluate Belc’s valuation before making stock transactions.
- CFOs and Financial Analysts: Optimize valuation workflows and assess financial forecasts.
- Startup Founders: Gain insights into the valuation methods used for established companies like Belc.
- Consultants: Create detailed valuation reports for your clientele.
- Students and Educators: Utilize real-world examples to practice and teach valuation methodologies.
Contents of the Template
- Historical Data: Contains past financial information and baseline forecasts for Belc CO., LTD. (9974T).
- DCF and Levered DCF Models: Comprehensive templates for determining the intrinsic value of Belc CO., LTD. (9974T).
- WACC Sheet: Pre-configured calculations for the Weighted Average Cost of Capital.
- Editable Inputs: Adjust key factors such as growth rates, EBITDA percentages, and CAPEX assumptions.
- Quarterly and Annual Statements: A detailed analysis of Belc CO., LTD. (9974T)'s financials.
- Interactive Dashboard: Dynamically visualize valuation outcomes and projections.
Disclaimer
All information, articles, and product details provided on this website are for general informational and educational purposes only. We do not claim any ownership over, nor do we intend to infringe upon, any trademarks, copyrights, logos, brand names, or other intellectual property mentioned or depicted on this site. Such intellectual property remains the property of its respective owners, and any references here are made solely for identification or informational purposes, without implying any affiliation, endorsement, or partnership.
We make no representations or warranties, express or implied, regarding the accuracy, completeness, or suitability of any content or products presented. Nothing on this website should be construed as legal, tax, investment, financial, medical, or other professional advice. In addition, no part of this site—including articles or product references—constitutes a solicitation, recommendation, endorsement, advertisement, or offer to buy or sell any securities, franchises, or other financial instruments, particularly in jurisdictions where such activity would be unlawful.
All content is of a general nature and may not address the specific circumstances of any individual or entity. It is not a substitute for professional advice or services. Any actions you take based on the information provided here are strictly at your own risk. You accept full responsibility for any decisions or outcomes arising from your use of this website and agree to release us from any liability in connection with your use of, or reliance upon, the content or products found herein.