
|
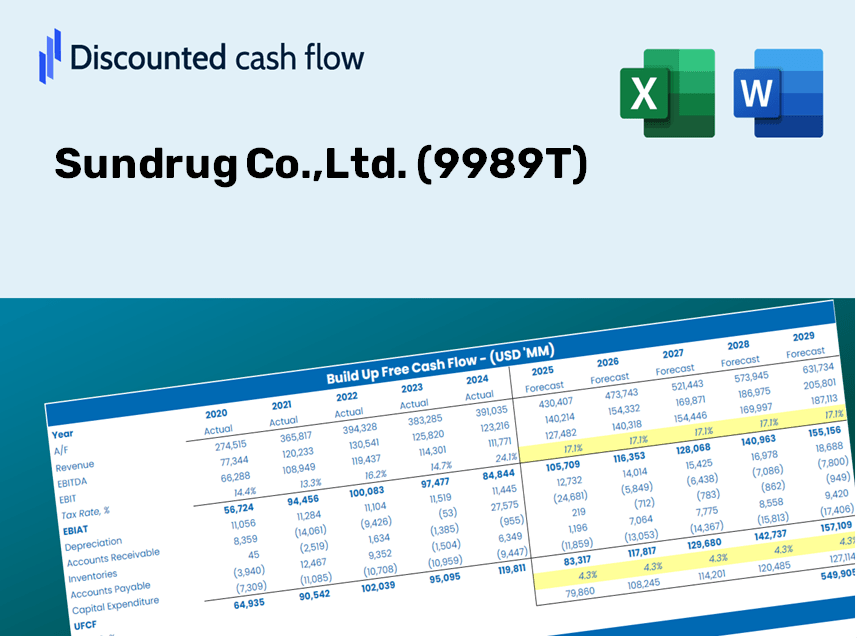
Sundrug Co., Ltd. (9989.T) Évaluation DCF |
Entièrement Modifiable: Adapté À Vos Besoins Dans Excel Ou Sheets
Conception Professionnelle: Modèles Fiables Et Conformes Aux Normes Du Secteur
Pré-Construits Pour Une Utilisation Rapide Et Efficace
Compatible MAC/PC, entièrement débloqué
Aucune Expertise N'Est Requise; Facile À Suivre
Sundrug Co.,Ltd. (9989.T) Bundle
Explorez l'avenir financier de Sundrug Co., Ltd. (9989T) avec notre calculatrice DCF conviviale! Entrez vos projections pour la croissance, les marges et les dépenses pour calculer la valeur intrinsèque de Sundrug Co., Ltd. (9989T) et améliorez votre stratégie d'investissement.
Benefits You Will Receive
- Accurate Financial Data for Sundrug Co.,Ltd. (9989T): Pre-loaded with historical and forecasted data for comprehensive analysis.
- Fully Customizable Template: Easily adjust essential inputs such as revenue growth, WACC, and EBITDA percentage.
- Real-Time Calculations: Watch the intrinsic value of Sundrug Co.,Ltd. (9989T) update instantly with your modifications.
- Professional Valuation Tool: Tailored for investors, analysts, and consultants aiming for precise DCF outcomes.
- User-Friendly Interface: Intuitive layout and straightforward instructions suitable for all skill levels.
Key Features
- 🔍 Real-Life SUNDRUG Financials: Pre-filled historical and projected data for Sundrug Co., Ltd. (9989T).
- ✏️ Fully Customizable Inputs: Modify all essential parameters (yellow cells) such as WACC, growth %, and tax rates.
- 📊 Professional DCF Valuation: Integrated formulas compute Sundrug’s intrinsic value using the Discounted Cash Flow method.
- ⚡ Instant Results: Visualize Sundrug’s valuation immediately upon adjustments.
- Scenario Analysis: Evaluate and compare outcomes based on different financial assumptions side-by-side.
How It Functions
- Download: Obtain the pre-prepared Excel file featuring Sundrug Co., Ltd. (9989T) financial data.
- Customize: Modify projections, such as revenue growth, EBITDA %, and WACC.
- Update Automatically: Enjoy real-time updates for intrinsic value and NPV calculations.
- Test Scenarios: Generate various projections and instantly compare the results.
- Make Decisions: Utilize the valuation outcomes to inform your investment strategy.
Why Opt for Sundrug Co., Ltd. ([9989T]) Calculator?
- Reliable Data: Utilize accurate financial figures from Sundrug Co., Ltd. for trustworthy valuation outcomes.
- Fully Customizable: Tailor essential variables such as growth rates, WACC, and tax rates to align with your forecasts.
- Efficient: Built-in calculations save you the hassle of beginning from scratch.
- Professional Tool: Crafted for the needs of investors, analysts, and consultants.
- Easy to Use: User-friendly design and clear, step-by-step guidance ensure accessibility for everyone.
Who Can Benefit from Sundrug Co., Ltd. (9989T)?
- Investment Professionals: Develop comprehensive and trustworthy valuation models for your portfolio assessments.
- Corporate Finance Departments: Evaluate valuation scenarios to inform and shape internal strategies.
- Advisors and Consultants: Equip clients with precise valuation insights specific to Sundrug Co., Ltd. (9989T).
- Students and Instructors: Utilize real-world data to enhance financial modeling education and practice.
- Pharmacy and Retail Analysts: Gain insights into how companies like Sundrug Co., Ltd. (9989T) are valued in the retail sector.
Contents of the Template
- Preloaded Sundrug Co.,Ltd. Data: Historical and projected financial data, including revenue, EBIT, and capital expenditures.
- DCF and WACC Models: Professional-grade spreadsheets for calculating the intrinsic value and Weighted Average Cost of Capital.
- Editable Inputs: Yellow-highlighted cells for modifying revenue growth, tax rates, and discount rates.
- Financial Statements: Detailed annual and quarterly financials for comprehensive analysis.
- Key Ratios: Metrics on profitability, leverage, and efficiency for performance evaluation.
- Dashboard and Charts: Visual representations of valuation outcomes and underlying assumptions.
Disclaimer
All information, articles, and product details provided on this website are for general informational and educational purposes only. We do not claim any ownership over, nor do we intend to infringe upon, any trademarks, copyrights, logos, brand names, or other intellectual property mentioned or depicted on this site. Such intellectual property remains the property of its respective owners, and any references here are made solely for identification or informational purposes, without implying any affiliation, endorsement, or partnership.
We make no representations or warranties, express or implied, regarding the accuracy, completeness, or suitability of any content or products presented. Nothing on this website should be construed as legal, tax, investment, financial, medical, or other professional advice. In addition, no part of this site—including articles or product references—constitutes a solicitation, recommendation, endorsement, advertisement, or offer to buy or sell any securities, franchises, or other financial instruments, particularly in jurisdictions where such activity would be unlawful.
All content is of a general nature and may not address the specific circumstances of any individual or entity. It is not a substitute for professional advice or services. Any actions you take based on the information provided here are strictly at your own risk. You accept full responsibility for any decisions or outcomes arising from your use of this website and agree to release us from any liability in connection with your use of, or reliance upon, the content or products found herein.