
|
ALCOA CORPORATION (AA) Évaluation DCF |
Entièrement Modifiable: Adapté À Vos Besoins Dans Excel Ou Sheets
Conception Professionnelle: Modèles Fiables Et Conformes Aux Normes Du Secteur
Pré-Construits Pour Une Utilisation Rapide Et Efficace
Compatible MAC/PC, entièrement débloqué
Aucune Expertise N'Est Requise; Facile À Suivre
Alcoa Corporation (AA) Bundle
Améliorez vos stratégies d'investissement avec la calculatrice DCF ALCOA Corporation (AA)! Examinez les finances ALCOA authentiques, ajustez les prévisions et dépenses de croissance et observez instantanément comment ces modifications affectent la valeur intrinsèque d'Alcoa Corporation (AA).
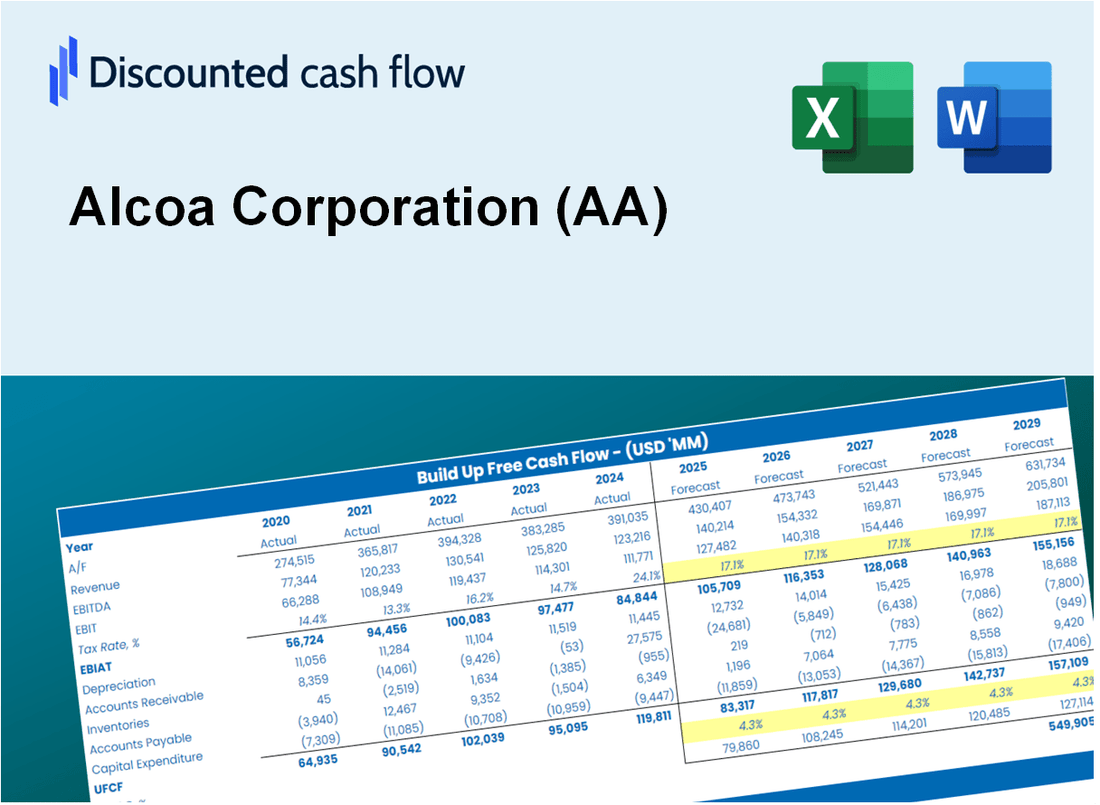
Discounted Cash Flow (DCF) - (USD MM)
| Year | AY1 2020 |
AY2 2021 |
AY3 2022 |
AY4 2023 |
AY5 2024 |
FY1 2025 |
FY2 2026 |
FY3 2027 |
FY4 2028 |
FY5 2029 |
|---|---|---|---|---|---|---|---|---|---|---|
| Revenue | 9,372.0 | 12,437.0 | 12,762.0 | 10,706.0 | 12,184.0 | 13,189.5 | 14,278.1 | 15,456.4 | 16,732.1 | 18,113.0 |
| Revenue Growth, % | 0 | 32.7 | 2.61 | -16.11 | 13.81 | 8.25 | 8.25 | 8.25 | 8.25 | 8.25 |
| EBITDA | 972.0 | 2,058.0 | 1,425.0 | 155.0 | 1,087.0 | 1,278.2 | 1,383.7 | 1,497.9 | 1,621.5 | 1,755.3 |
| EBITDA, % | 10.37 | 16.55 | 11.17 | 1.45 | 8.92 | 9.69 | 9.69 | 9.69 | 9.69 | 9.69 |
| Depreciation | 653.0 | 664.0 | 617.0 | 632.0 | 642.0 | 746.9 | 808.5 | 875.3 | 947.5 | 1,025.7 |
| Depreciation, % | 6.97 | 5.34 | 4.83 | 5.9 | 5.27 | 5.66 | 5.66 | 5.66 | 5.66 | 5.66 |
| EBIT | 319.0 | 1,394.0 | 808.0 | -477.0 | 445.0 | 531.3 | 575.1 | 622.6 | 674.0 | 729.6 |
| EBIT, % | 3.4 | 11.21 | 6.33 | -4.46 | 3.65 | 4.03 | 4.03 | 4.03 | 4.03 | 4.03 |
| Total Cash | 1,607.0 | 1,814.0 | 1,363.0 | 944.0 | 1,138.0 | 1,597.8 | 1,729.6 | 1,872.4 | 2,026.9 | 2,194.2 |
| Total Cash, percent | .0 | .0 | .0 | .0 | .0 | .0 | .0 | .0 | .0 | .0 |
| Account Receivables | 556.0 | 884.0 | 909.0 | 808.0 | 1,239.0 | 999.2 | 1,081.7 | 1,171.0 | 1,267.6 | 1,372.2 |
| Account Receivables, % | 5.93 | 7.11 | 7.12 | 7.55 | 10.17 | 7.58 | 7.58 | 7.58 | 7.58 | 7.58 |
| Inventories | 1,398.0 | 1,956.0 | 2,427.0 | 2,158.0 | 1,998.0 | 2,274.3 | 2,462.0 | 2,665.2 | 2,885.2 | 3,123.3 |
| Inventories, % | 14.92 | 15.73 | 19.02 | 20.16 | 16.4 | 17.24 | 17.24 | 17.24 | 17.24 | 17.24 |
| Accounts Payable | 1,403.0 | 1,674.0 | 1,757.0 | 1,714.0 | 1,805.0 | 1,926.2 | 2,085.2 | 2,257.3 | 2,443.6 | 2,645.3 |
| Accounts Payable, % | 14.97 | 13.46 | 13.77 | 16.01 | 14.81 | 14.6 | 14.6 | 14.6 | 14.6 | 14.6 |
| Capital Expenditure | -353.0 | -390.0 | -480.0 | -531.0 | -580.0 | -537.7 | -582.1 | -630.1 | -682.1 | -738.4 |
| Capital Expenditure, % | -3.77 | -3.14 | -3.76 | -4.96 | -4.76 | -4.08 | -4.08 | -4.08 | -4.08 | -4.08 |
| Tax Rate, % | 79.24 | 79.24 | 79.24 | 79.24 | 79.24 | 79.24 | 79.24 | 79.24 | 79.24 | 79.24 |
| EBITAT | -313.5 | 498.8 | -141.6 | -531.7 | 92.4 | 166.3 | 180.1 | 194.9 | 211.0 | 228.4 |
| Depreciation | ||||||||||
| Changes in Account Receivables | ||||||||||
| Changes in Inventories | ||||||||||
| Changes in Accounts Payable | ||||||||||
| Capital Expenditure | ||||||||||
| UFCF | -564.5 | 157.8 | -417.6 | -103.7 | -25.6 | 460.2 | 295.3 | 319.7 | 346.1 | 374.6 |
| WACC, % | 9.79 | 10.3 | 9.79 | 11.22 | 10.08 | 10.24 | 10.24 | 10.24 | 10.24 | 10.24 |
| PV UFCF | ||||||||||
| SUM PV UFCF | 1,363.7 | |||||||||
| Long Term Growth Rate, % | 2.00 | |||||||||
| Free cash flow (T + 1) | 382 | |||||||||
| Terminal Value | 4,640 | |||||||||
| Present Terminal Value | 2,851 | |||||||||
| Enterprise Value | 4,214 | |||||||||
| Net Debt | 1,680 | |||||||||
| Equity Value | 2,534 | |||||||||
| Diluted Shares Outstanding, MM | 214 | |||||||||
| Equity Value Per Share | 11.84 |
What You Will Receive
- Authentic AA Financial Data: Pre-populated with Alcoa’s historical and projected figures for thorough analysis.
- Completely Customizable Template: Easily adjust key inputs such as revenue growth, WACC, and EBITDA %.
- Instant Calculations: Watch Alcoa’s intrinsic value change in real-time based on your modifications.
- Expert Valuation Tool: Tailored for investors, analysts, and consultants aiming for precise DCF outcomes.
- Intuitive Design: Clear layout and straightforward instructions suitable for all skill levels.
Key Features
- Pre-Loaded Data: Alcoa Corporation’s historical financial statements and pre-filled forecasts.
- Fully Adjustable Inputs: Edit WACC, tax rates, revenue growth, and EBITDA margins.
- Instant Results: See Alcoa Corporation’s intrinsic value recalculate in real time.
- Clear Visual Outputs: Dashboard charts display valuation results and key metrics.
- Built for Accuracy: A professional tool for analysts, investors, and finance experts.
How It Works
- Step 1: Download the Excel file.
- Step 2: Review pre-entered Alcoa data (historical and projected).
- Step 3: Adjust key assumptions (yellow cells) based on your analysis.
- Step 4: View automatic recalculations for Alcoa’s intrinsic value.
- Step 5: Use the outputs for investment decisions or reporting.
Why Choose the Alcoa Corporation (AA) Calculator?
- Precision: Utilizes real Alcoa financial data to ensure accuracy.
- Adaptability: Built for users to easily adjust and experiment with inputs.
- Efficiency: Eliminate the need to create a DCF model from the ground up.
- Expert-Level: Crafted with the precision and functionality expected from CFOs.
- Intuitive: Simple to navigate, even for those without extensive financial modeling skills.
Who Should Use This Product?
- Investors: Assess Alcoa Corporation’s (AA) valuation prior to making investment decisions.
- CFOs and Financial Analysts: Enhance valuation methods and evaluate financial forecasts.
- Startup Founders: Discover the valuation strategies of established companies like Alcoa Corporation.
- Consultants: Provide detailed valuation analyses for your clients regarding Alcoa Corporation.
- Students and Educators: Utilize current data to learn and teach valuation principles through Alcoa Corporation.
What the Template Contains
- Pre-Filled Data: Contains Alcoa Corporation's historical financials and projections.
- Discounted Cash Flow Model: An editable DCF valuation model featuring automatic calculations.
- Weighted Average Cost of Capital (WACC): A dedicated sheet for calculating WACC using custom inputs.
- Key Financial Ratios: Evaluate Alcoa’s profitability, efficiency, and leverage metrics.
- Customizable Inputs: Easily modify revenue growth, margins, and tax rates.
- Clear Dashboard: Visual representations including charts and tables summarizing key valuation outcomes.
Disclaimer
All information, articles, and product details provided on this website are for general informational and educational purposes only. We do not claim any ownership over, nor do we intend to infringe upon, any trademarks, copyrights, logos, brand names, or other intellectual property mentioned or depicted on this site. Such intellectual property remains the property of its respective owners, and any references here are made solely for identification or informational purposes, without implying any affiliation, endorsement, or partnership.
We make no representations or warranties, express or implied, regarding the accuracy, completeness, or suitability of any content or products presented. Nothing on this website should be construed as legal, tax, investment, financial, medical, or other professional advice. In addition, no part of this site—including articles or product references—constitutes a solicitation, recommendation, endorsement, advertisement, or offer to buy or sell any securities, franchises, or other financial instruments, particularly in jurisdictions where such activity would be unlawful.
All content is of a general nature and may not address the specific circumstances of any individual or entity. It is not a substitute for professional advice or services. Any actions you take based on the information provided here are strictly at your own risk. You accept full responsibility for any decisions or outcomes arising from your use of this website and agree to release us from any liability in connection with your use of, or reliance upon, the content or products found herein.